[Breaking 21:30 KST] US April CPI 3.8% — oil spike kills Fed rate-cut bets
Trending · May 12, 2026 · 08:30 ET

US April CPI came in at 3.8% headline and 2.8% core, beating consensus on both lines. The Iran-war oil shock has flushed 2026 Fed-cut bets and is hitting Korean investors’ four core assets at once.
US April CPI printed a shock number. Headline 3.8% and core 2.8% both beat consensus, and the headline reading is the hottest since May 2023 — a three-year peak.
The Iran war (which began on February 28) drove international oil to a four-year high, and April was the month that pass-through landed in the CPI basket. Markets are now repricing the year as “2026 Fed rate cuts effectively cancelled.”
“Inflation is starting to eat into wages again”
— Heather Long, Chief Economist, Navy Federal Credit Union
For Korea-based investors this is not a distant headline. The KRW/USD rate, US equities, crypto, and bonds-and-gold all land inside the impact zone at once. This piece distills the US April CPI print into eight pivots.
1. US April CPI — the headline numbers
The U.S. Bureau of Labor Statistics released the April Consumer Price Index on May 12 (ET). Primary text is on the BLS CPI release page.

| Metric | April | Consensus | March |
|---|---|---|---|
| Headline CPI (YoY) | 3.8% | 3.7% | 3.3% |
| Headline CPI (MoM) | 0.6% | 0.6% | 0.9% |
| Core CPI (YoY) | 2.8% | 2.7% | 2.6% |
| Core CPI (MoM) | 0.4% | 0.3% | 0.2% |
3.8% headline is the highest since May 2023. The bigger concern is that core CPI at 2.8% also beat the 2.7% consensus — the energy shock is broadening, not staying narrow.
⚠ Real wages — April real hourly earnings fell -0.5% MoM and -0.3% YoY. For the first time since April 2023, inflation has fully erased nominal wage growth.
2. Drivers — energy, shelter, and tariffs pressing at once
The single largest contributor to the April CPI print was energy. By line item, energy alone accounted for more than 40% of the monthly increase.

Energy — Iran war drove a 17.9% surge
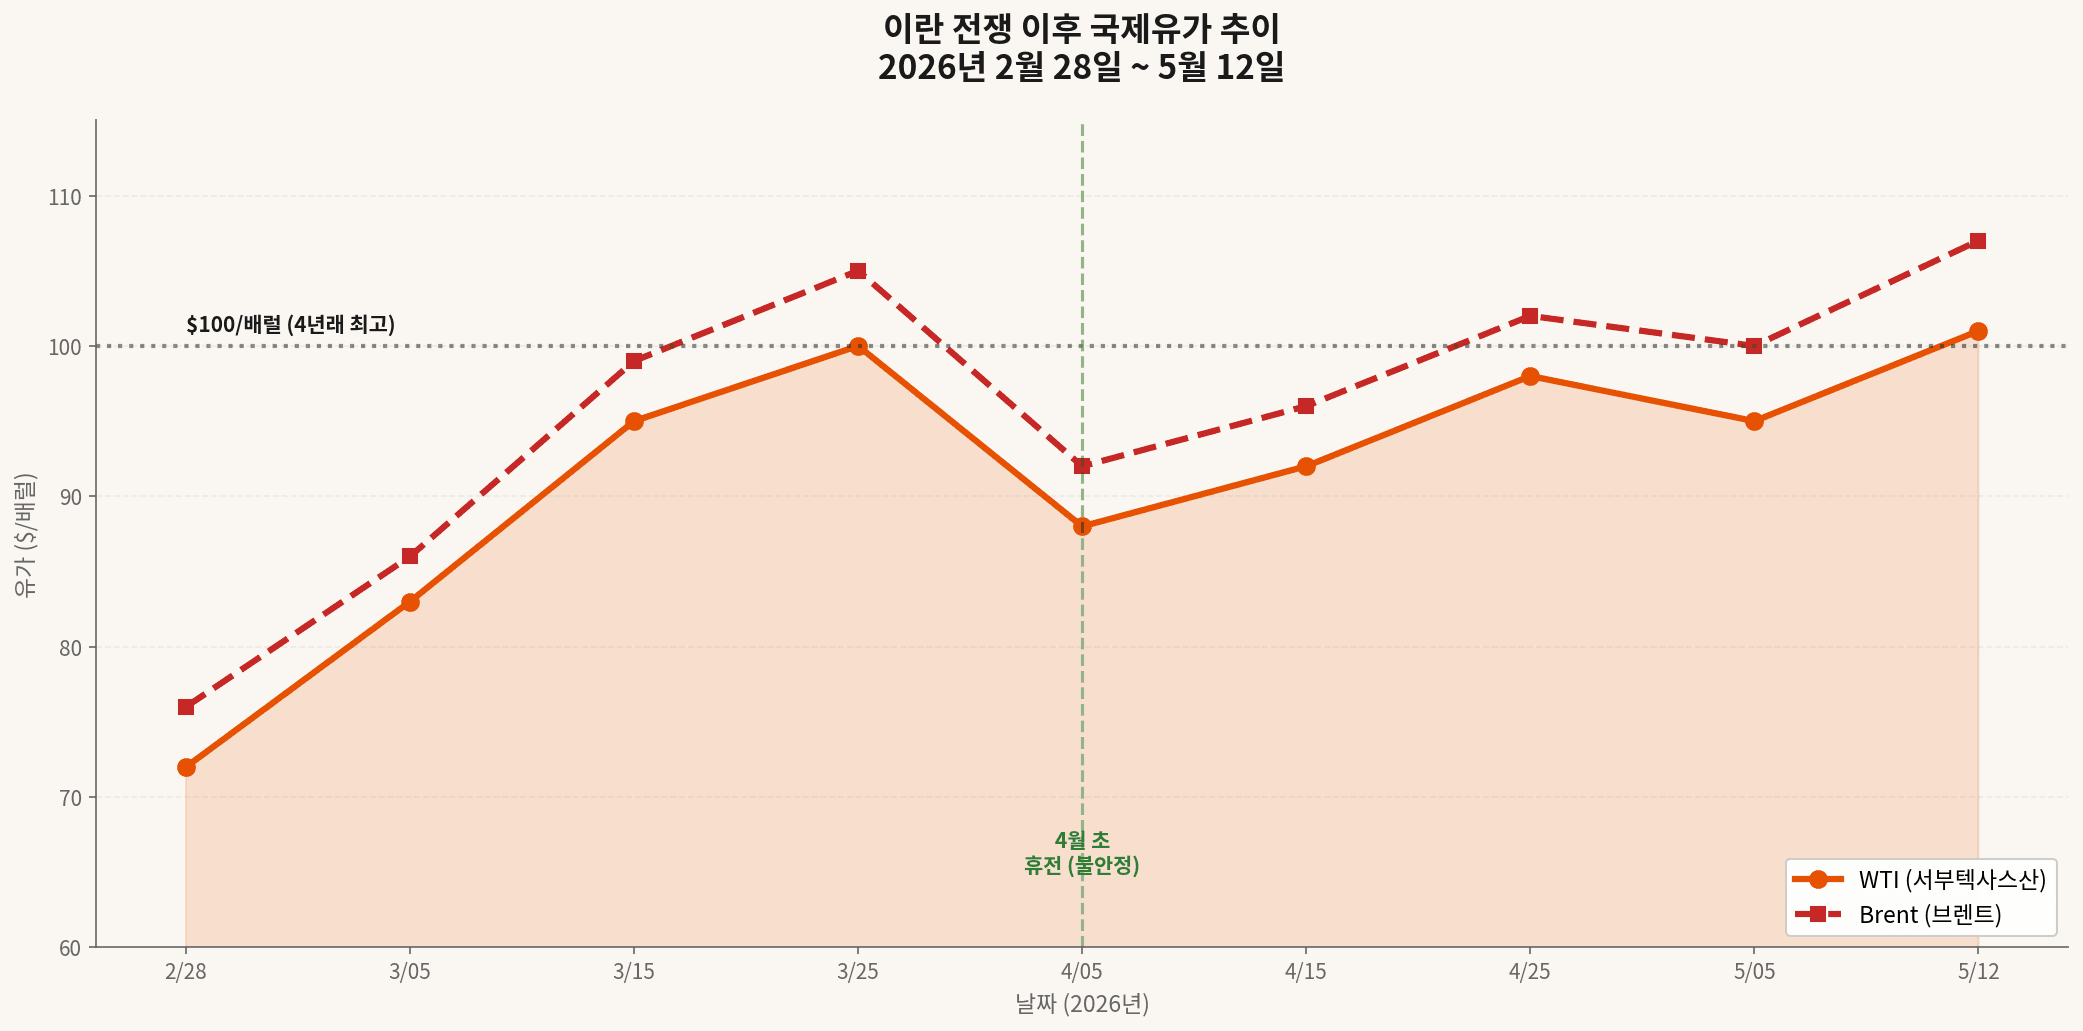
Energy printed +17.9% YoY, the largest one-month gain since September 2022. Gasoline ran +28.4%; fuel oil (home heating) screamed +54.3%. Following the February 28 US-Israeli strikes on Iran, WTI briefly punched above $100/bbl. Even after the early-April ceasefire, Strait-of-Hormuz blockade risk has kept the benchmark back near $101.
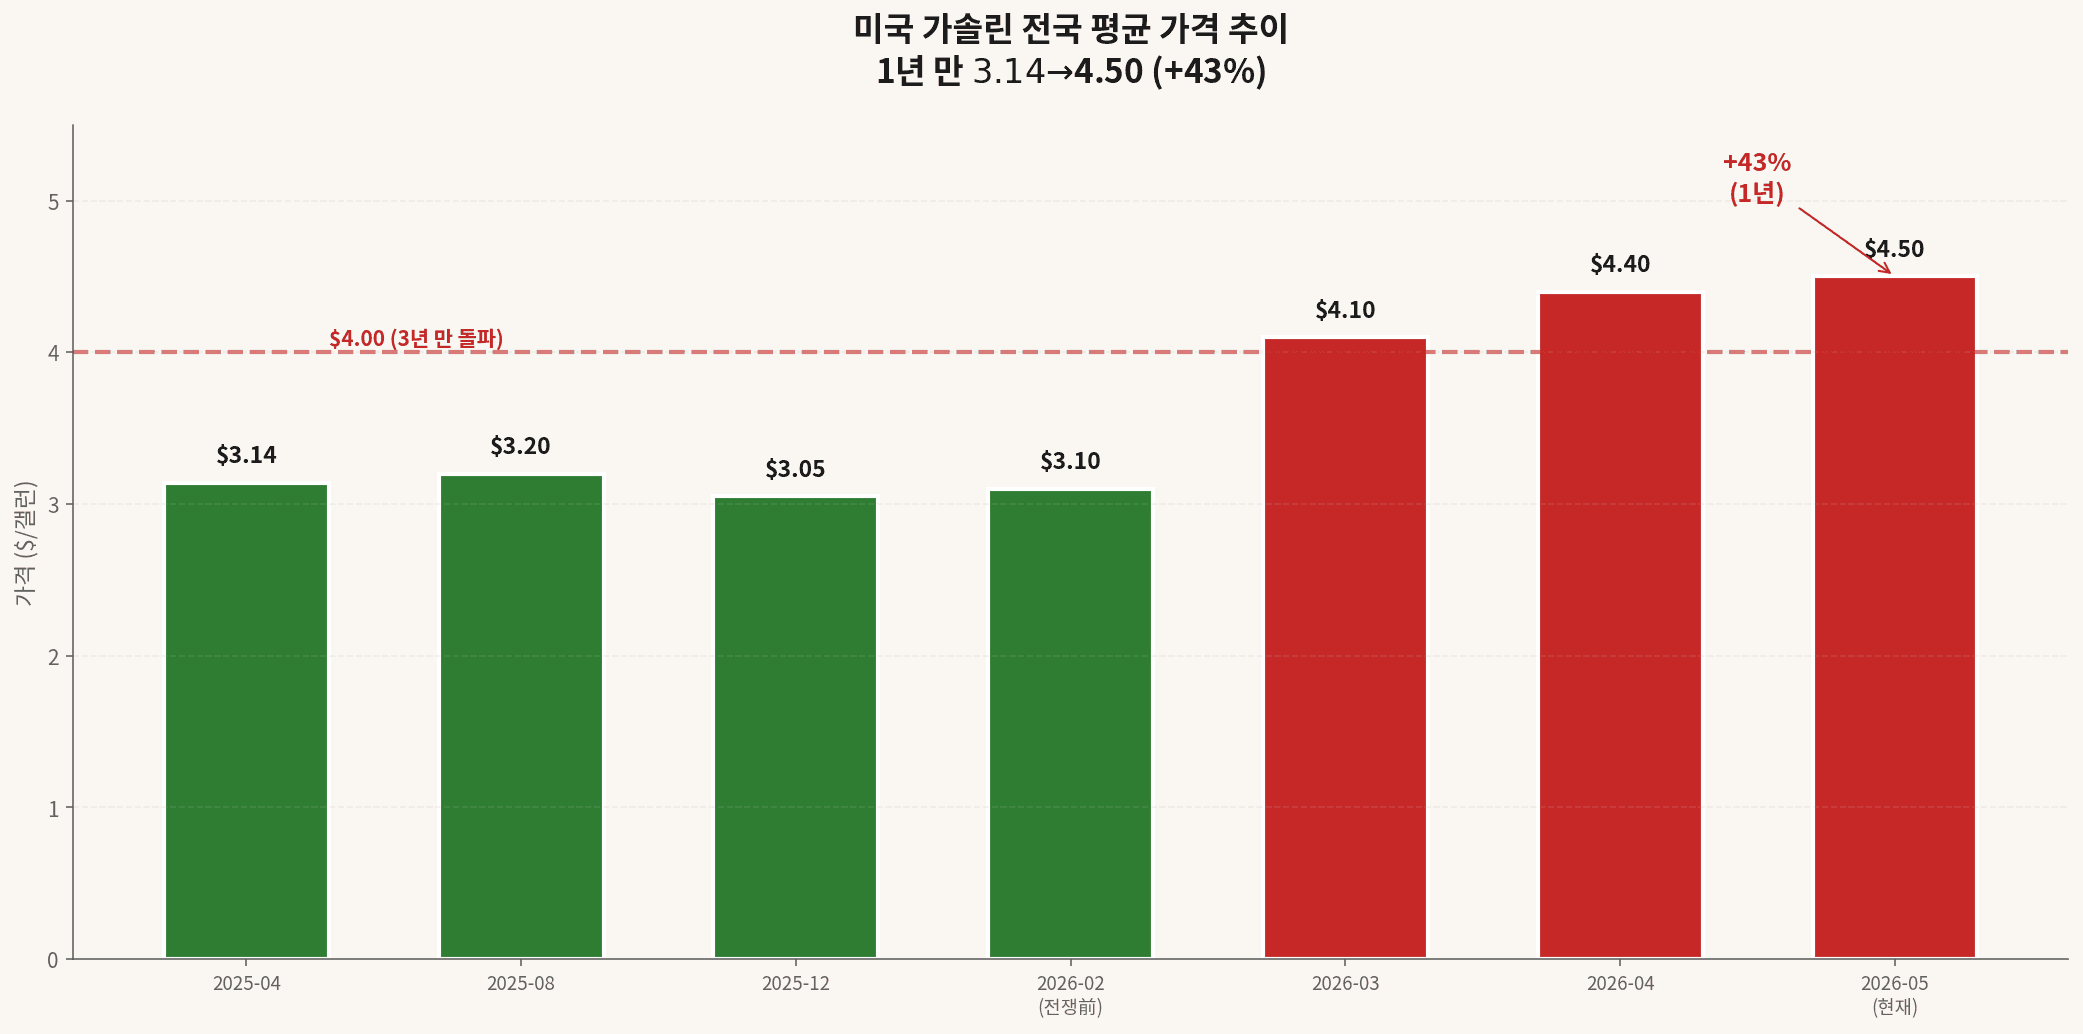
US national-average gasoline at $4.50/gallon — first $4 print in three years
Shelter — boomerang from the October 2025 BLS data gap
Shelter accelerated again to +0.6% MoM. Part of that is mechanical — during the October 2025 government shutdown, BLS couldn’t fully collect rent data and effectively assumed “0” rent inflation that month; the catch-up landed six months later in April. But Pantheon Macro and others argue the underlying trend is rising even net of the technical bounce.
Tariffs — apparel, furniture, and airfare in direct hit
- Airfare — +2.8% MoM, +20.7% YoY (jet-fuel direct hit)
- Apparel — +0.6% (tariff pass-through in earnest)
- Furniture and appliances — +0.7% (tariffs plus shipping)
- Food (beef) — +14.8% YoY (feed, fertilizer, and freight combined)
3. Disinflators — healthcare and autos offer some relief
Not every line went up. April data still shows clear disinflationary pockets.
| Line | MoM | Read |
|---|---|---|
| Medical services | -0.1% | Medical inflation cooling |
| Hospital services | -0.3% | Hospital prices easing |
| Health insurance | -0.4% | Premium pressure abating |
| New vehicles | -0.2% | Auto demand softening |
| Used vehicles | 0.0% | Flat (stabilizing) |
★ Dovish read — Pimco and Edward Jones, among others, flag these disinflation pockets. Their thesis: strip out energy and the trend is cooling, so the Fed can still squeeze one cut between September and December.
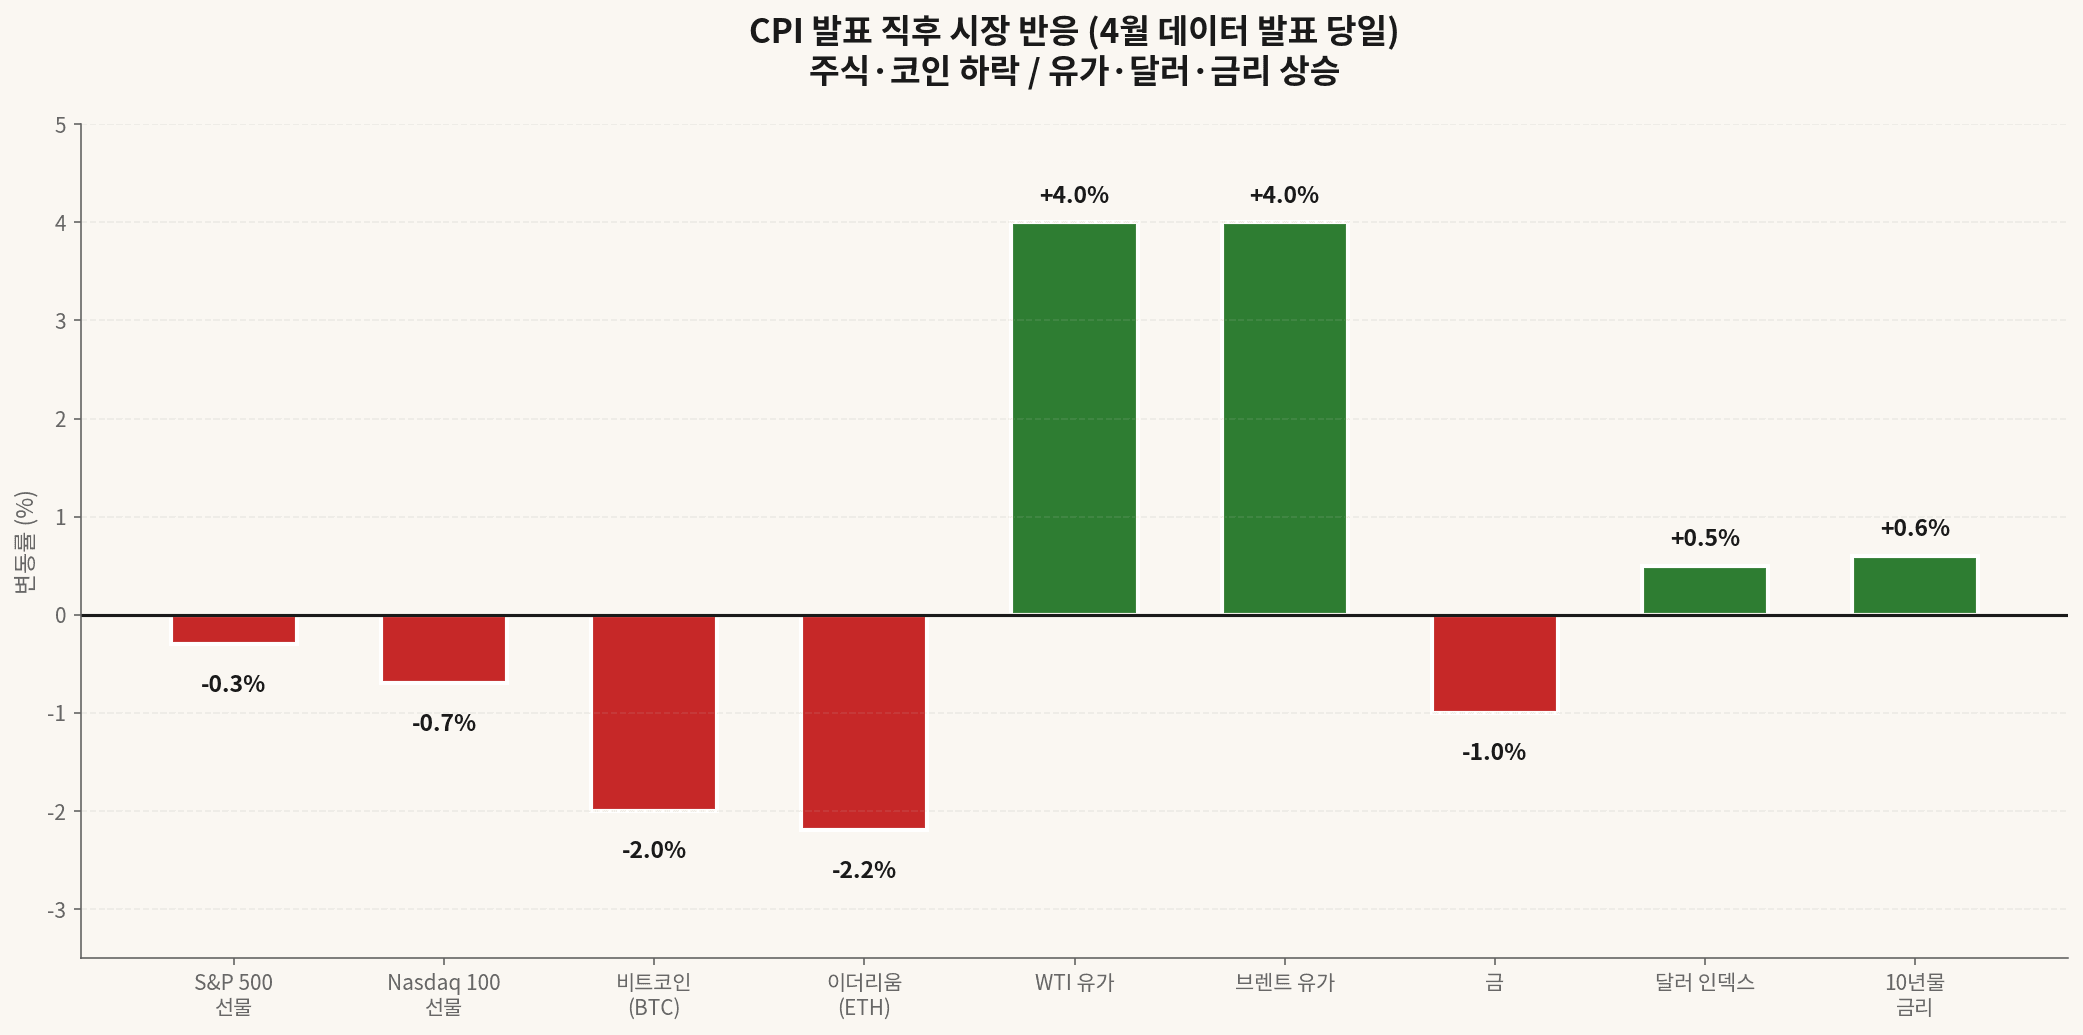
4. Market reaction — equities and crypto down, oil, dollar, yields up
Markets reacted instantly. Risk assets sold off, while select havens and inflation hedges rallied — a textbook hawkish read.
Equities
S&P 500 futures -0.3%, Nasdaq 100 futures -0.7%. High-PER semis like Micron (MU) and SanDisk (SNDK) took the biggest hits; energy and financials held up as relative defensives.
Crypto
Bitcoin was already weak heading into the print and slid below $81,000. Ether fell harder, breaking the $2,300 support. CoinGlass logged ~$268M in 24-hour liquidations, of which $159M was long-side.
CoinDesk read the tape as “rate-cut optimism and the gold rally failing to spill into crypto,” with inflation data setting the near-term direction. CME Group is set to launch BTC volatility futures on June 1.
Bonds, dollar, commodities
- US 10-year yield — +0.6 ppt, through 4.5%
- Dollar Index (DXY) — +0.5%
- WTI / Brent — both +4% (Hormuz risk)
- Gold — -1% (lost $4,700, short-term profit-taking)
- Silver — +3% (industrial-demand hedge)
5. Fed outlook — on hold to mid-2027
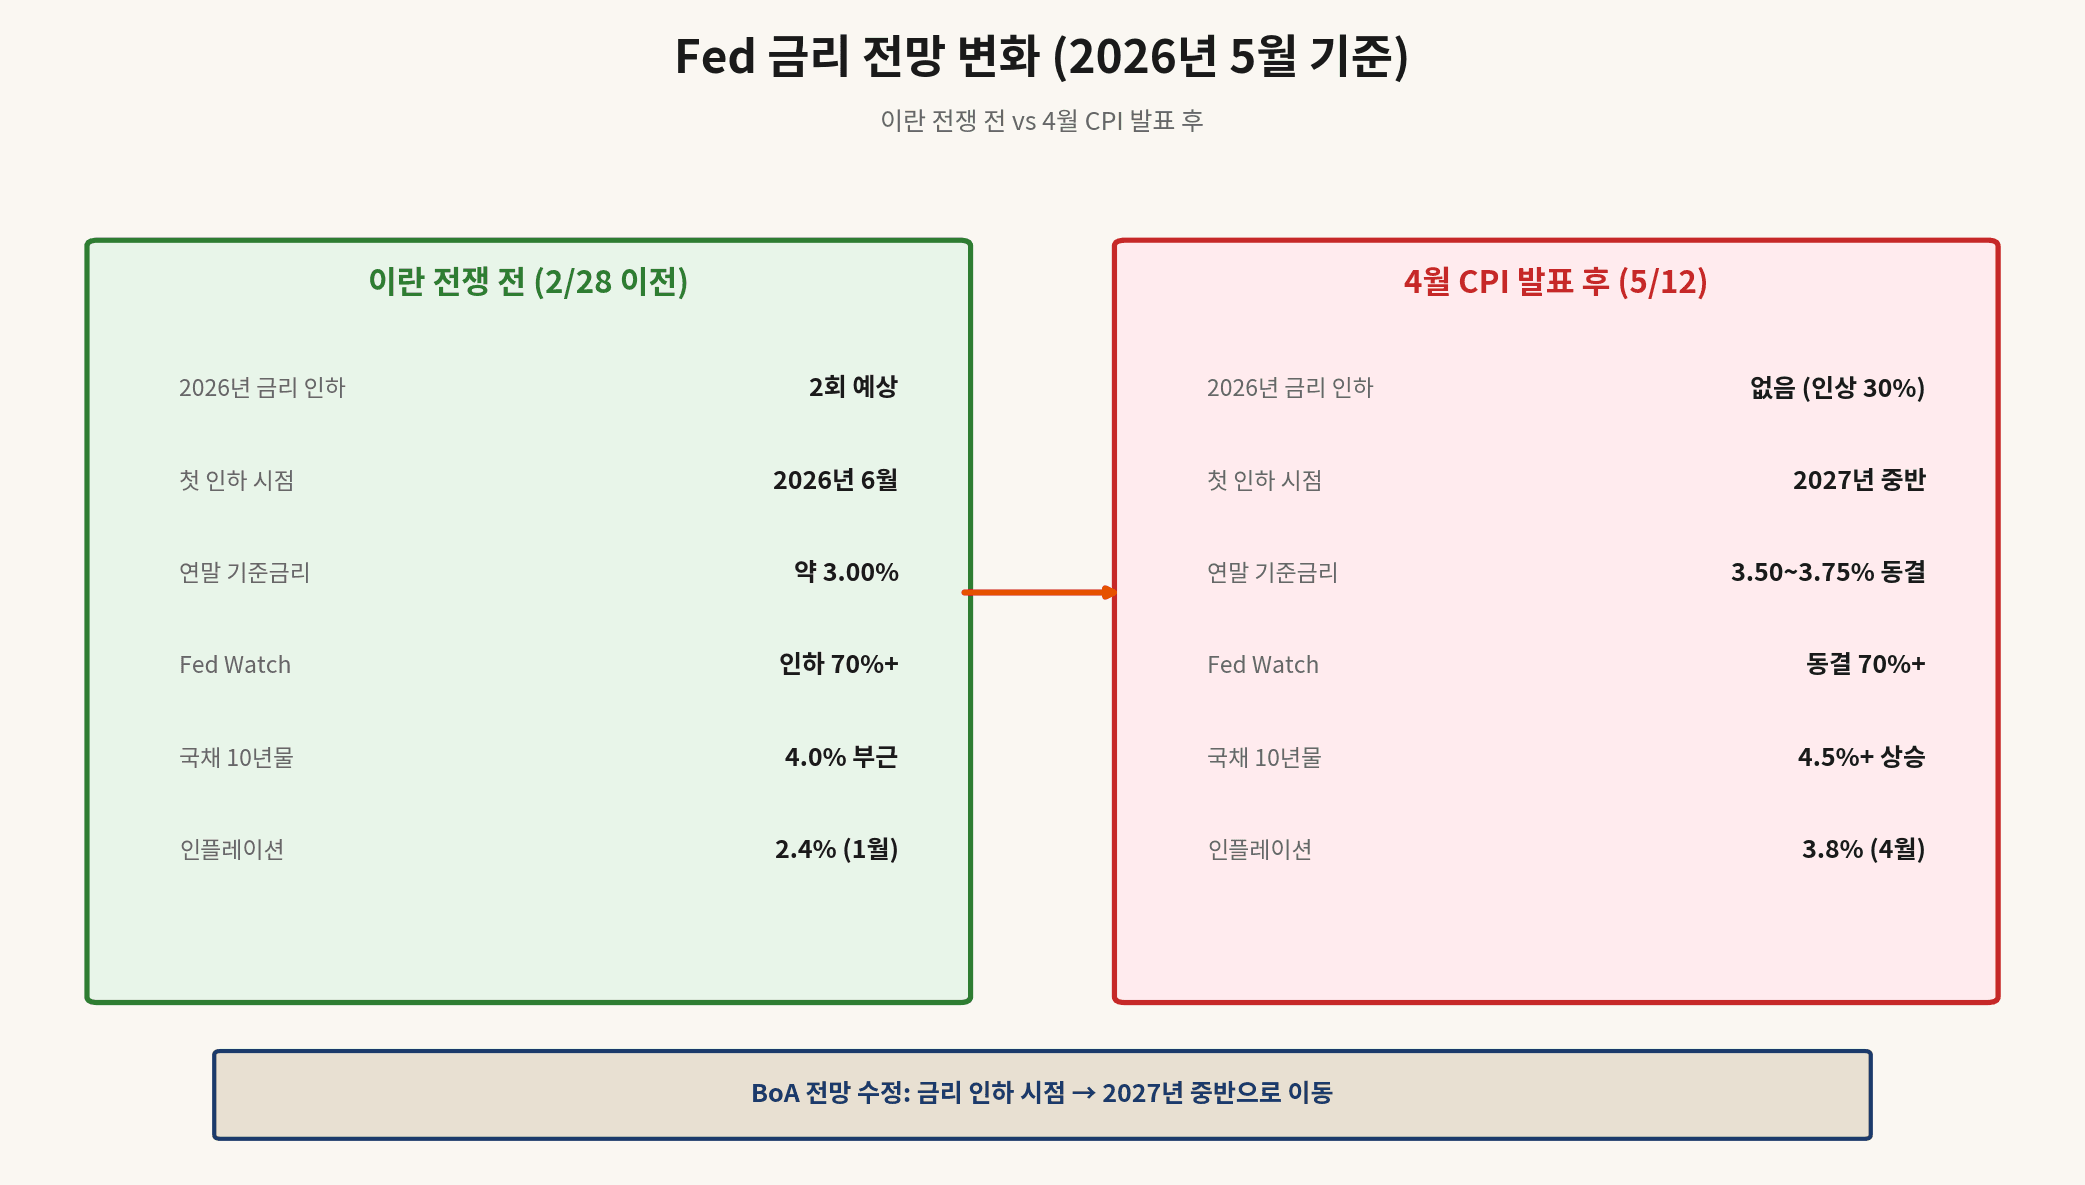
Markets have stopped waiting for 2026 cuts. Bank of America moved the first cut to mid-2027; CME FedWatch puts 2026 cuts at near-zero probability and has even started pricing a 30% chance of a hike.
CORE TAKEAWAY
The Fed funds target sits at 3.50–3.75%. The late-April meeting held rates, but four dissents — the most since 1992. Governor Stephen Miran voted for a 25 bp cut; three regional Fed presidents dissented on other grounds.
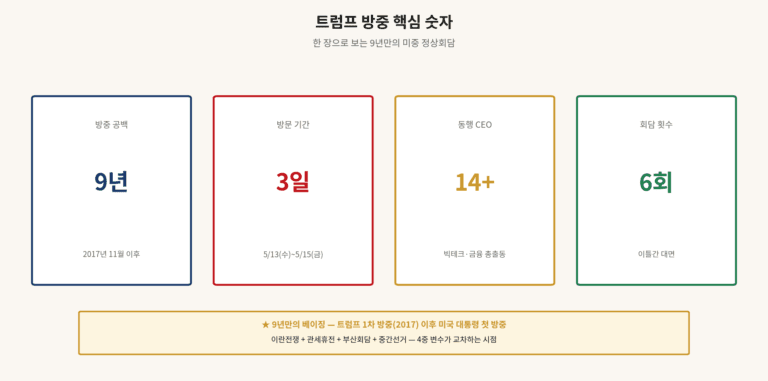
Likely-next-chair Kevin Warsh has long argued for cuts, but the current inflation backdrop makes immediate easing a hard sell. The May 15 chair handover is the market’s next major variable.
Policy calendar — June FOMC (6/17–18), July FOMC (7/29–30), September FOMC (9/16–17). Next CPI (May data) prints June 10.
6. Street split — hawks vs doves

| HAWKS (inflation first) | DOVES (growth first) |
|---|---|
| JPMorgan — higher-for-longer risk | Edward Jones — economy resilient to shocks |
| Morgan Stanley — cuts pushed out further | Kevin Warsh (chair-elect) — cuts still needed |
| Citigroup — energy spillover broadens | Stephen Miran (Fed governor) — voted for a 25 bp cut |
| Bank of America — first cut now mid-2027 | Pimco — flags healthcare and auto disinflation |
| Northlight Asset — market now prices hike risk | Wells Fargo — falling real wages will cool demand |
| Pantheon Macro — shelter pressure to persist | Goldman Sachs — core trend may still cool |
| Moody’s (M. Zandi) — household stress lingering | CME FedWatch subset — September cut bets alive |
Hawks have the upper hand. CME FedWatch prices a hold at 70%+ and a hike at 30%. But the dovish core arguments — healthcare and auto disinflation, demand cooling on falling real wages — are real data, not vibes. Friday’s PPI (5/13) and Saturday’s retail sales (5/14) will settle which side gets the next round.
Aggregate view
7. Korea-investor impact — four asset checks
US April CPI hits Korean investors on four fronts simultaneously: the won/dollar rate, US equities, crypto, and bonds-and-gold.
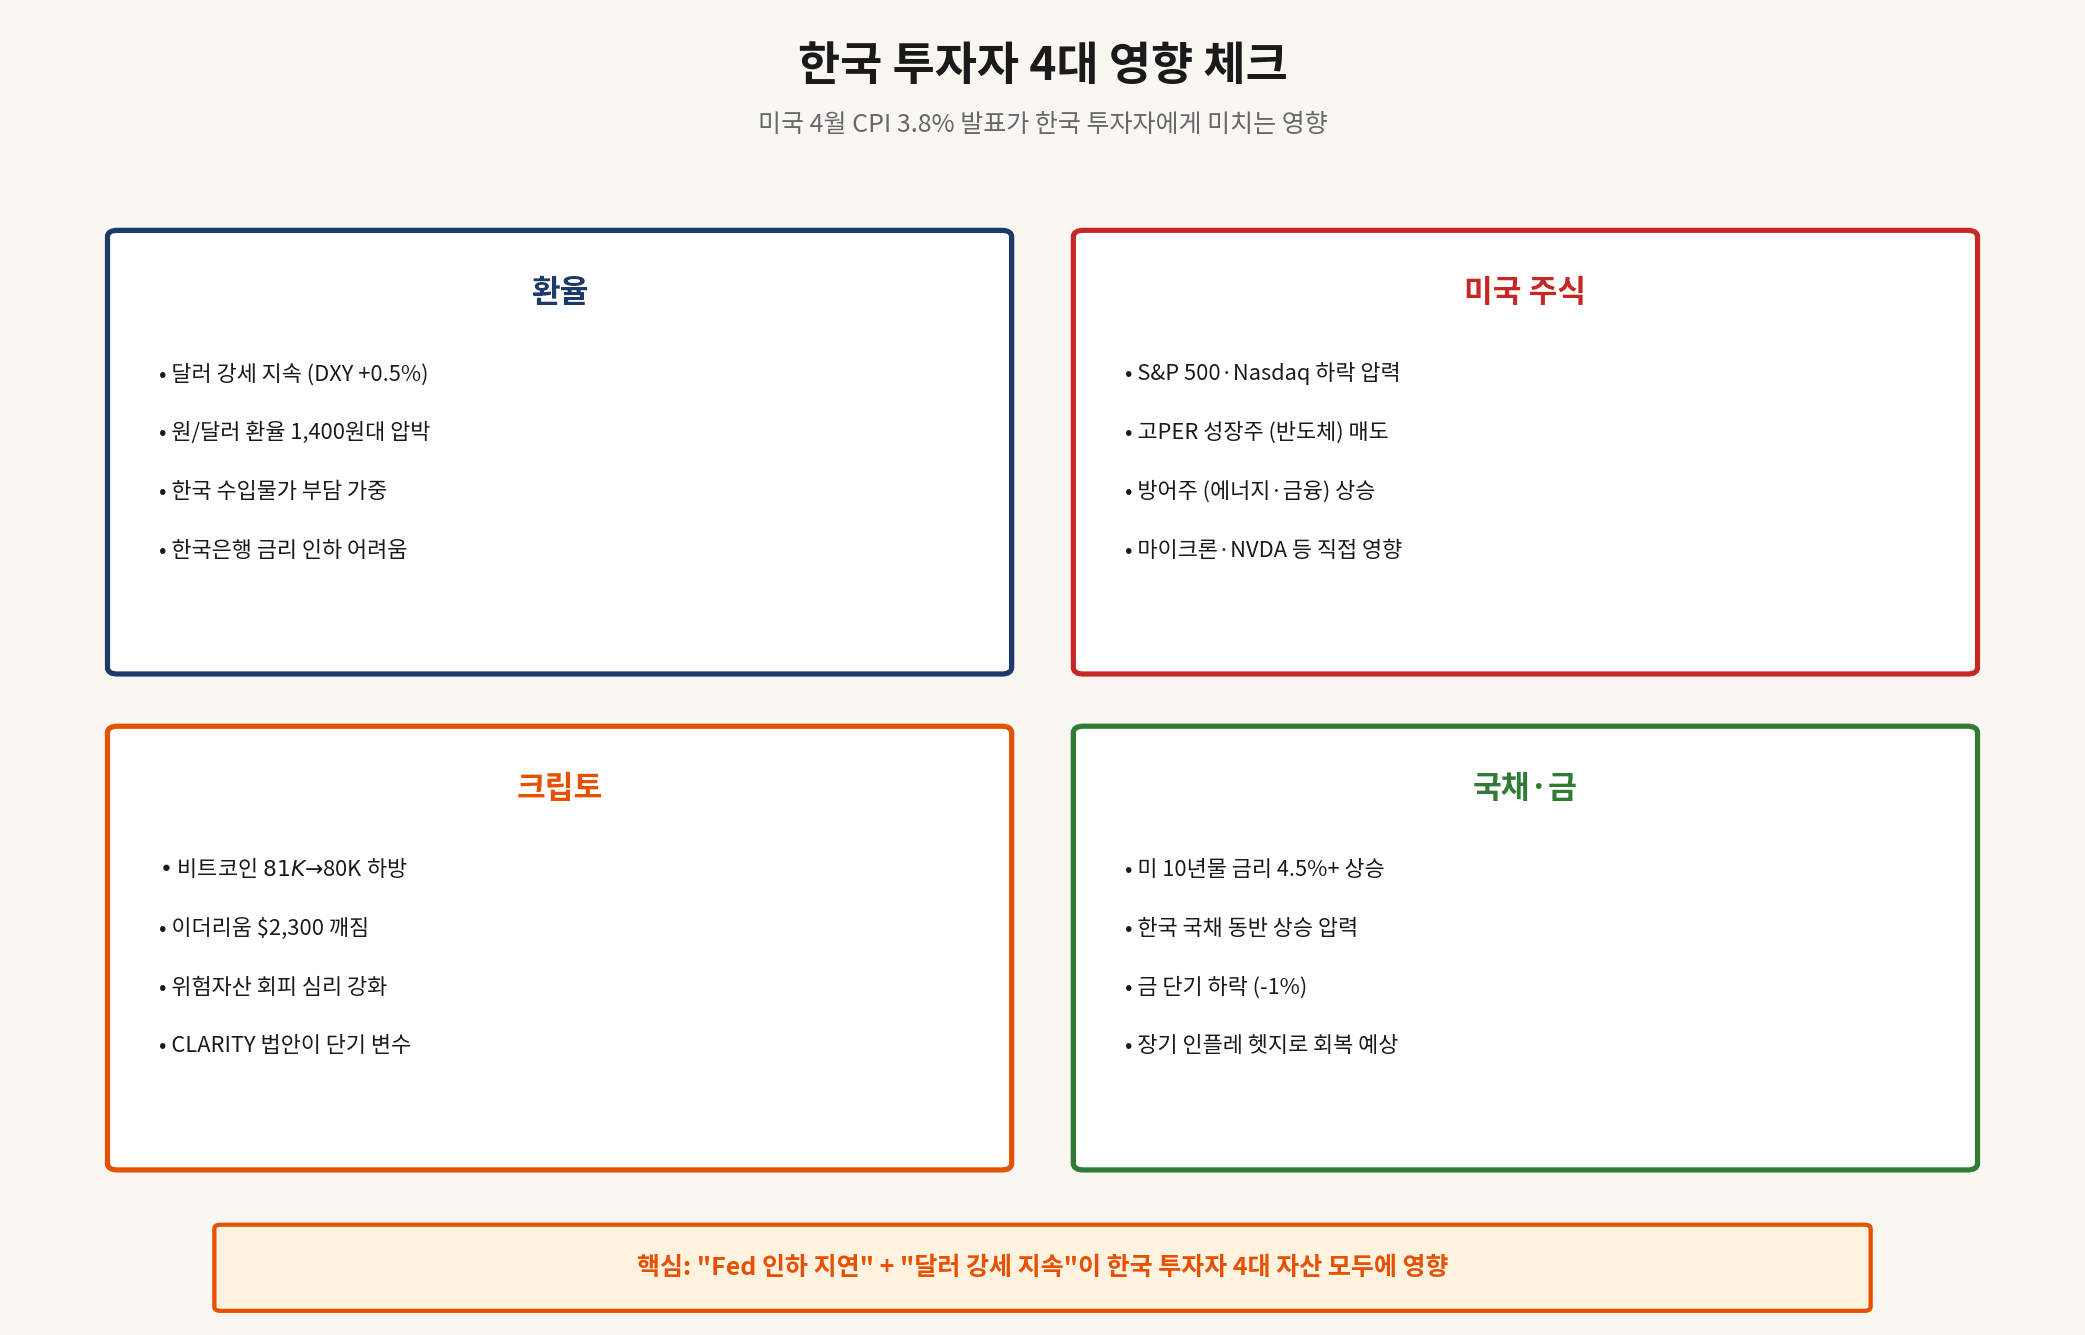
① FX — KRW/USD pushing back to 1,400
Dollar strength (DXY +0.5%) naturally lifts KRW/USD. As of May 12, the pair is testing the 1,400 zone. Korean import costs rise, and the BOK loses room to cut rates in step with a Fed that just lost room itself.
② US equities — sell high-PER growth, buy defensives
Nasdaq -0.7% says long-duration growth absorbs the most pressure. Energy (Exxon, Chevron), financials (JPM, BAC), and utility-style defensives outperform. NVDA, AAPL, MSFT and other mega-cap tech face expanded short-term volatility. Watch premarket on the CNBC Nasdaq page.
③ Crypto — BTC testing $80K support
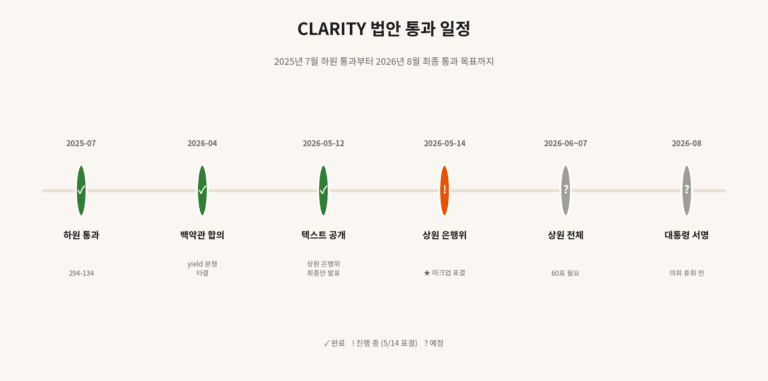
Bitcoin is testing the $80K psychological support. The May 14 CLARITY Act Senate Banking markup is a separate idiosyncratic catalyst that could decouple BTC from the macro tape in the short run.
④ Bonds and gold — short-term volatile, long-term inflation hedge
US 10-year through 4.5% drags Korean Treasury yields up alongside. Gold took a -1% near-term hit but, under a prolonged-inflation scenario, the consensus is that it recovers.
⚠ For Korea-based investors — macro prints like CPI hit during the Korean night, so the first reaction is done in US premarket before the local cash open. Right-size the book ahead of the June 10 May-CPI print; reacting after the move is the hard road.
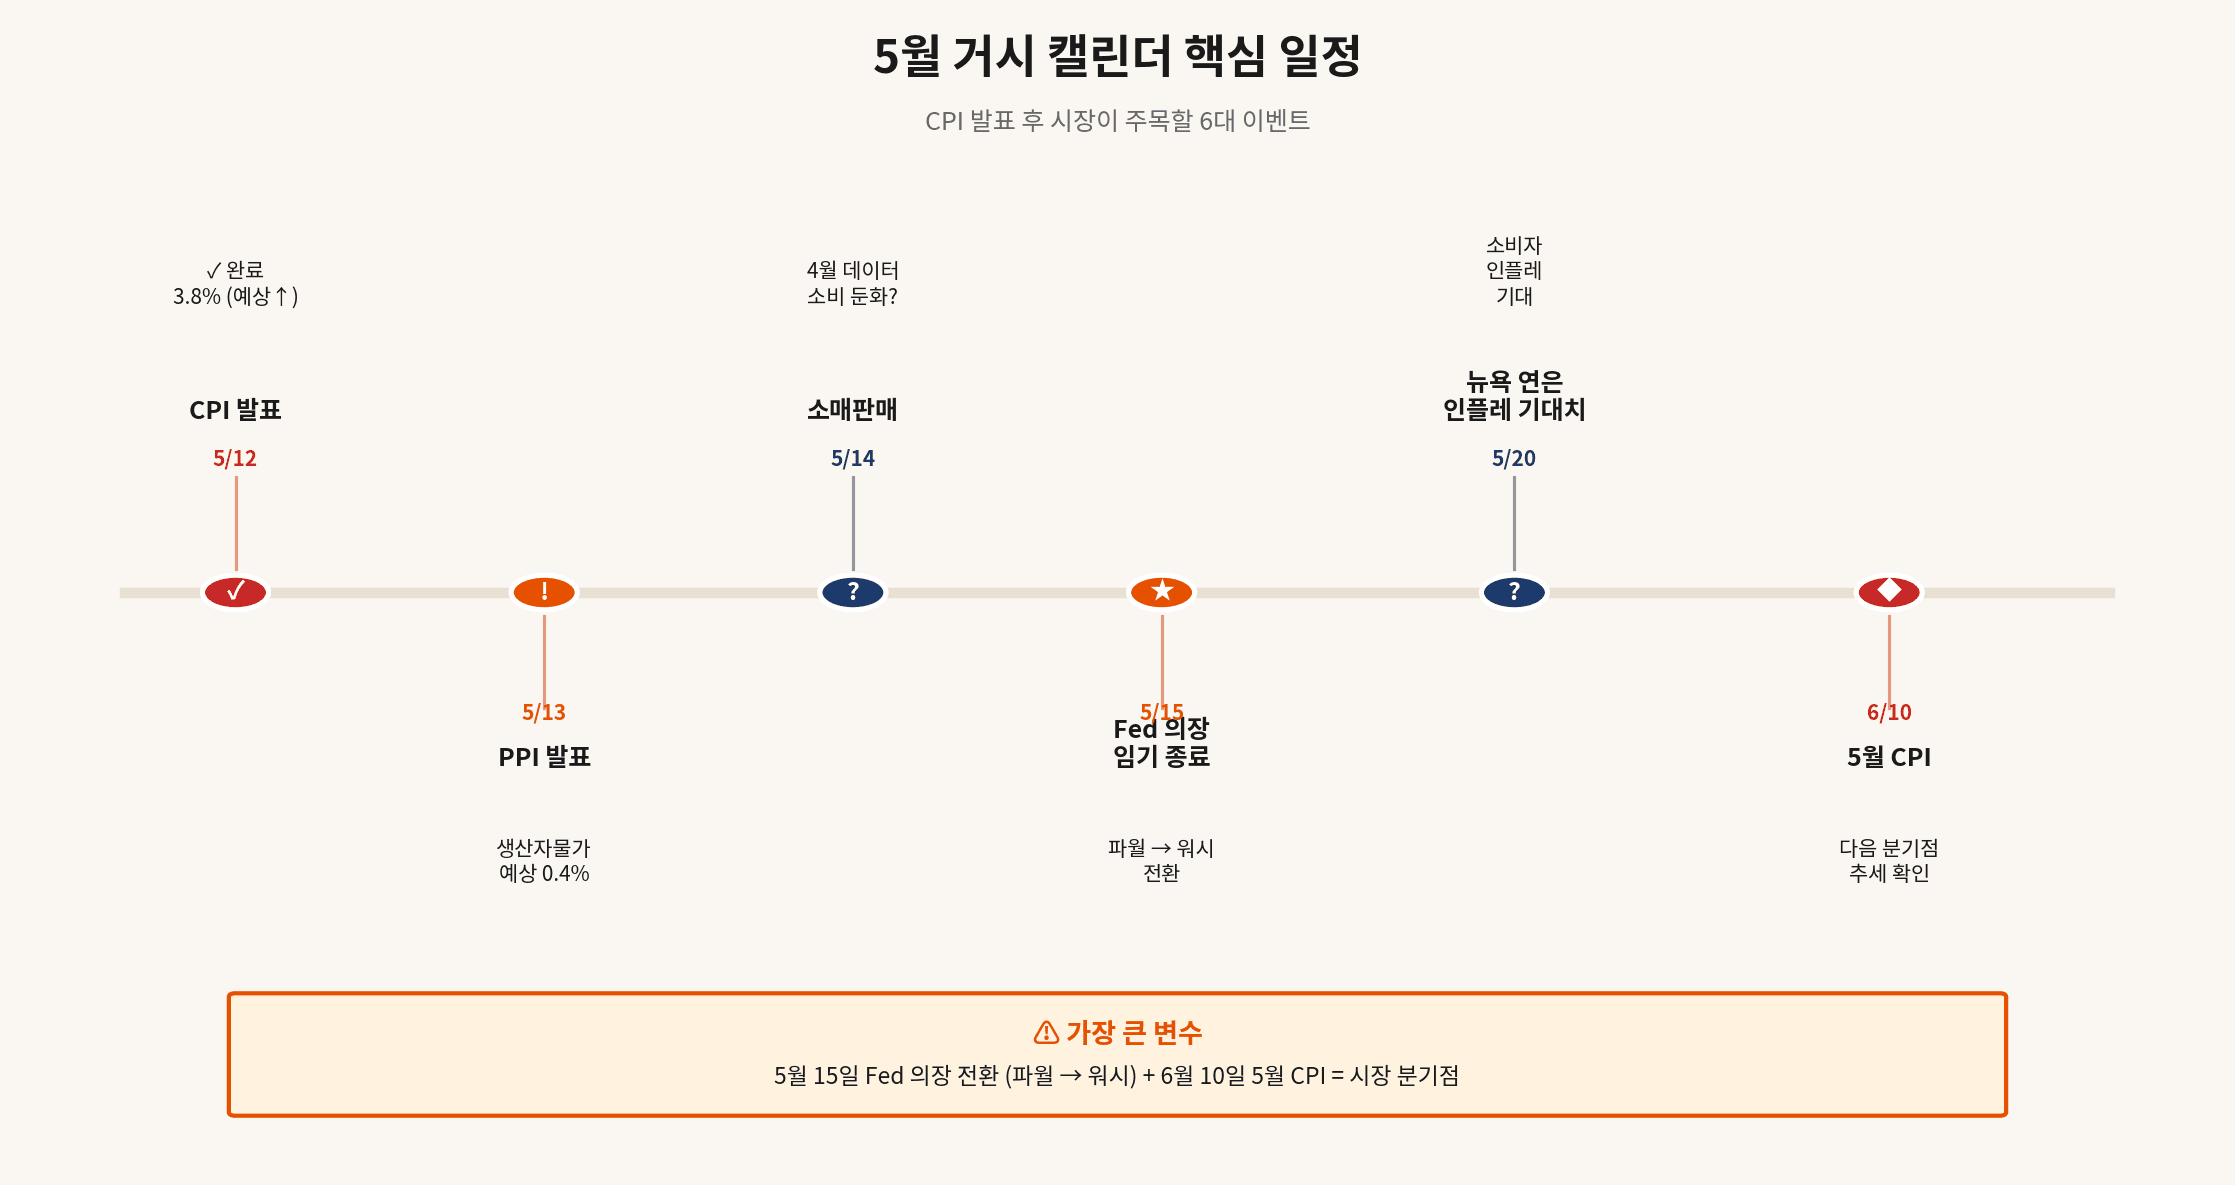
8. Conclusion — the May macro calendar is the next pivot
| Date | Event | Impact |
|---|---|---|
| 5/12 (done) | April CPI release | 3.8% shock |
| 5/13 | April PPI (producer prices) | Confirm inflation breadth |
| 5/14 | April retail sales | Demand-cooling signal |
| 5/15 | Fed chair handover (Powell → Warsh) | ★ Policy pivot point |
| 5/20 | NY Fed inflation expectations | Second-round effects |
| 6/10 | May CPI release | Whether April trend holds |
Transient or structural —
— US April CPI in one line
the answer sits in the next month of data
US April CPI at 3.8% is unambiguously a shock, but whether it’s a transient energy spike or a structural re-acceleration is not yet settled. If May PPI and retail sales confirm broadening inflation, the hawkish view becomes the base case. If, strip-out-energy, the trend is cooling, doves get the next mic.
For Korea-based investors the two pivots that matter most are the May 15 Fed chair handover and the June 10 May CPI print. Volatility through that window will be elevated; right-size the book and wait for the new chair’s first signal plus one more CPI before re-engaging on size.