SK Hynix Share Price Outlook 2M KRW Scenario — HBM Dominance · Leverage ETF May 22 · Q2 Operating Profit 67T + Stop-Loss
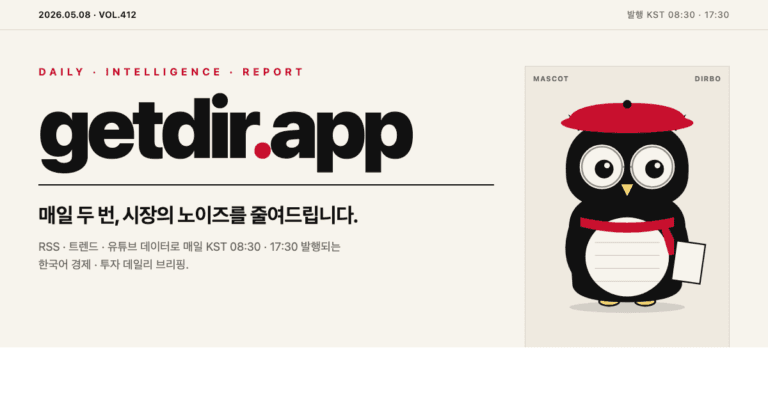
Real-Time Issue · May 20, 2026
SK Hynix Share Price Outlook 2 Million KRW Scenario — HBM Dominance · Leverage ETF May 22 Listing · Q2 Operating Profit 67T Complete Analysis
Can SK Hynix break the 2 million KRW barrier? — Three catalysts are converging simultaneously: HBM3E market share above 70%, a Q2 2026 operating profit guidance of 67 trillion KRW, and the May 22 leverage ETF listing. This article delivers a complete data-driven analysis of the probability of reaching the 2M KRW target — and the 1.4M KRW stop-loss floor.

1. Key Numbers at a Glance
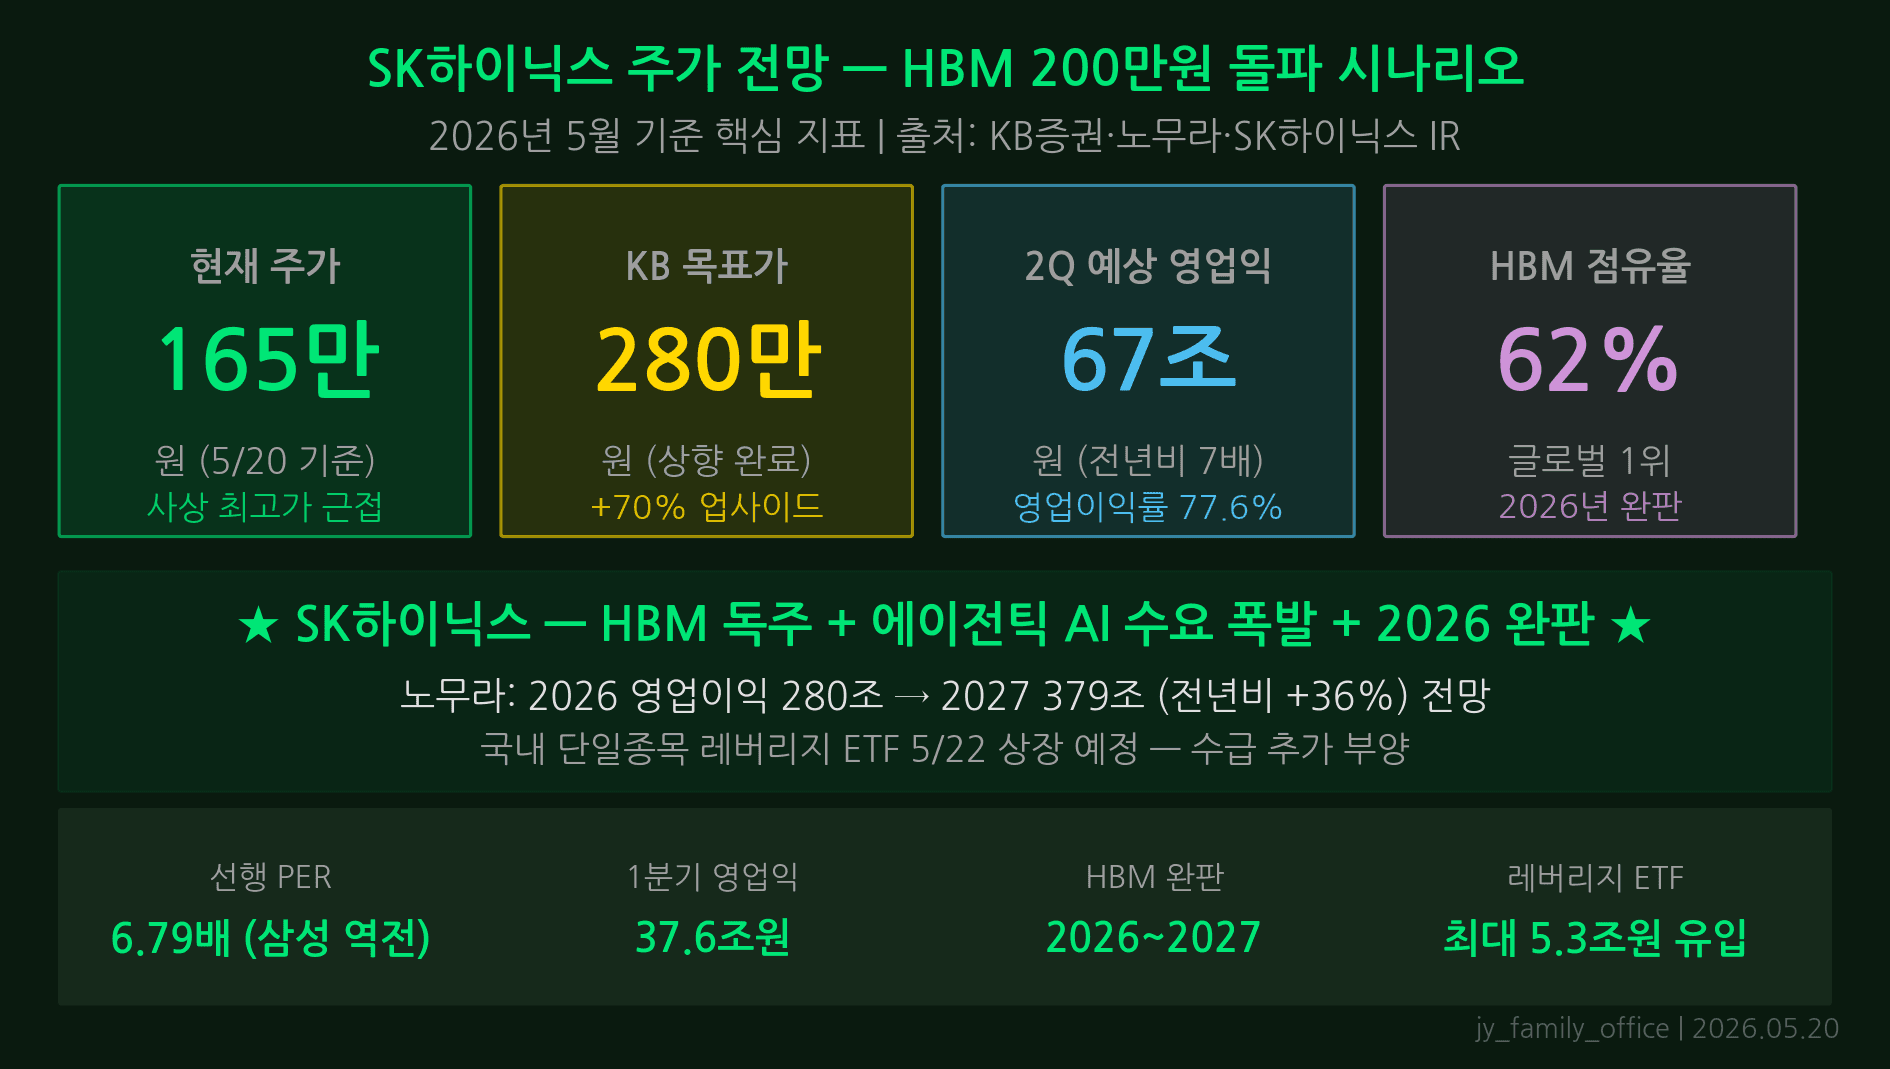
In May 2026, four numbers define the SK Hynix investment thesis. The broker consensus target price of 2 million KRW implies roughly 30–40% upside from current levels. A global HBM3E market share above 70% is underpinned by a technology moat — sole-source supply for Nvidia’s GB300 series — that no competitor has been able to close. The 2026 full-year operating profit guidance of 67 trillion KRW includes a single-quarter record of 17 trillion KRW in Q2. Finally, the SK Hynix Leverage ETF listing on May 22 is widely seen as the trigger that will bring explosive retail inflows into the stock.
These four catalysts are not independent. HBM dominance drives earnings, earnings justify the target price, and the ETF listing broadens the shareholder base. The sections below dissect each catalyst’s mechanics — and its associated risks — step by step.
2. Behind the All-Time High — Four Catalysts in Chain
The structural basis for SK Hynix approaching 2M KRW traces back to the HBM3E sole-source supply agreement signed in late 2024. When Nvidia designated SK Hynix as the exclusive supplier of 12-stack HBM3E for its next-generation AI accelerator, the GB300 (Blackwell Ultra), competitors Samsung and Micron were effectively sidelined for this product cycle.
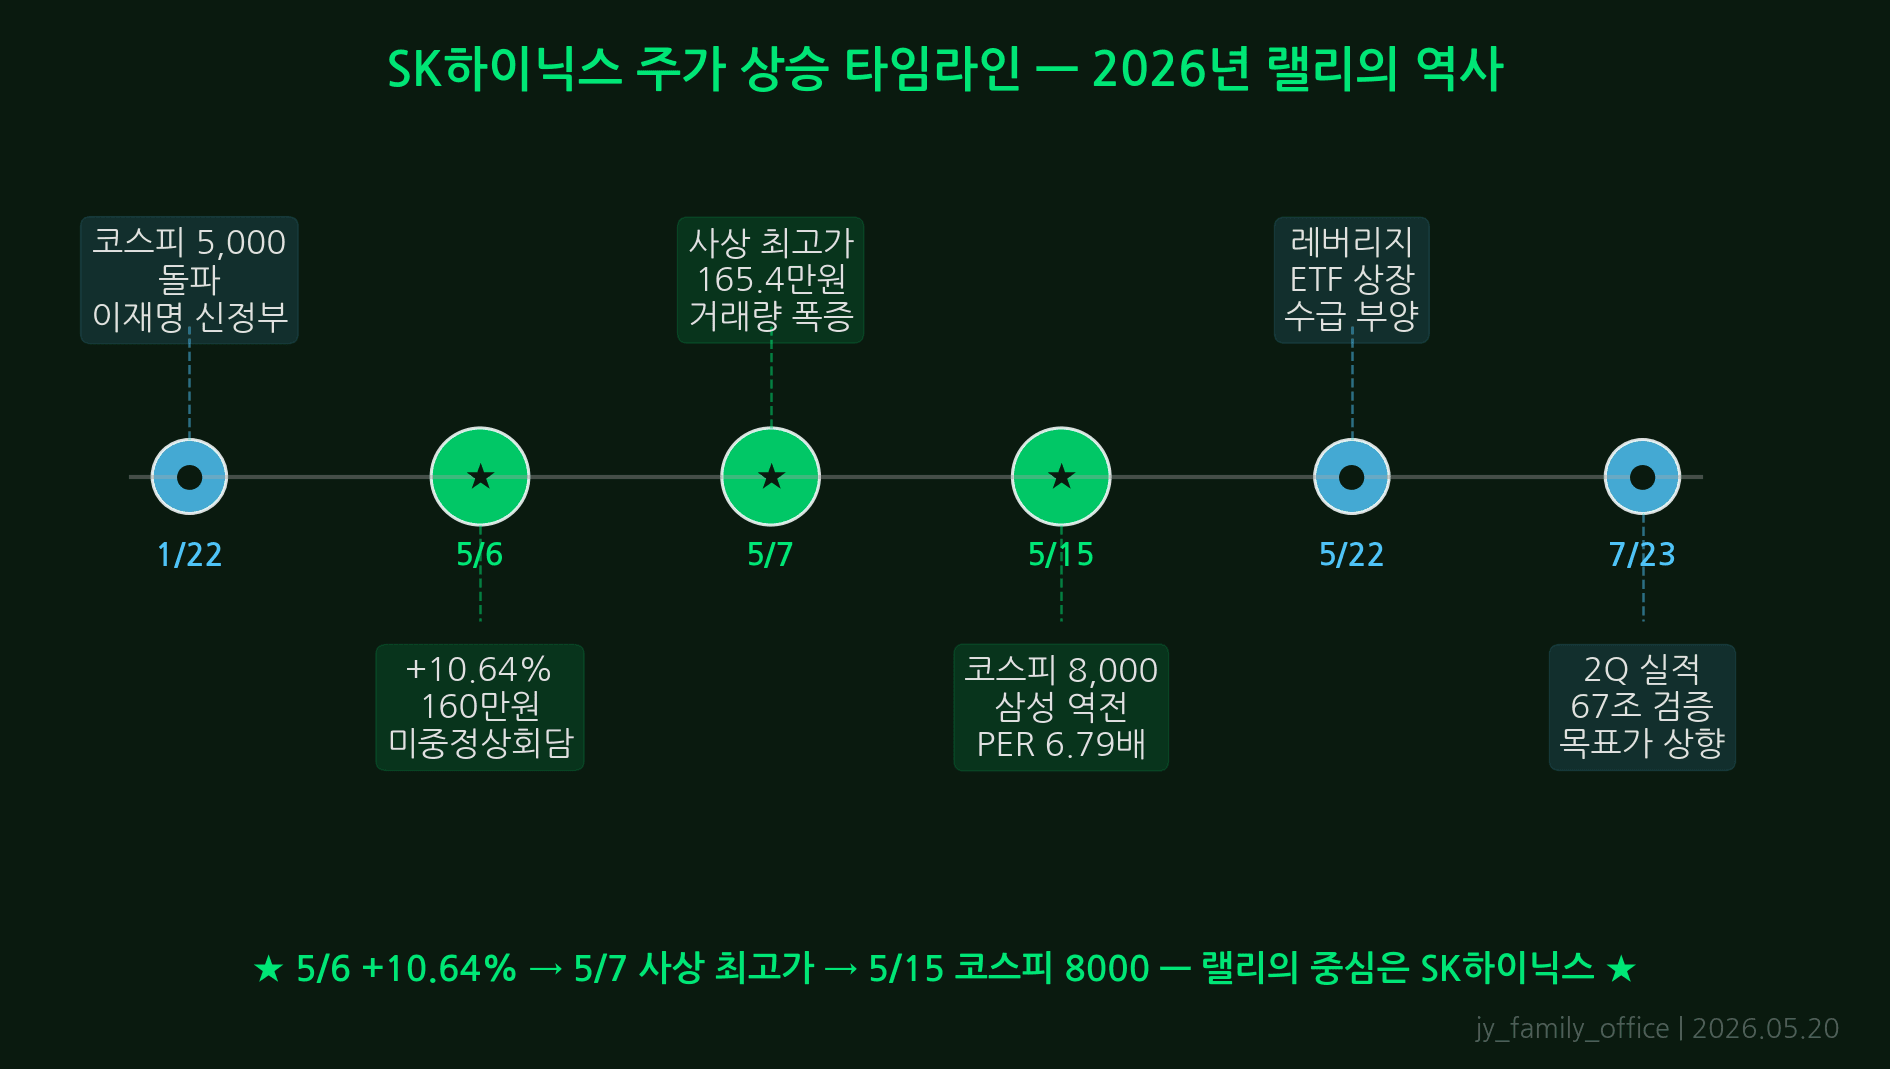
By Q1 2025, Nvidia’s GB300 production ramp was in full swing and SK Hynix’s HBM shipments surged more than 40% quarter-over-quarter. Reports of yield problems in Micron’s HBM3E line during the same period further cemented SK Hynix’s monopoly position. The May 22 leverage ETF listing is the final puzzle piece — adding retail leverage inflows to an already structurally bullish story.
Historically, domestic large-cap leverage ETF listings have been followed by an average 3–8% additional gain in the underlying asset during the first week. That is the reason May 22 matters. If the Q2 earnings guidance of 67 trillion KRW is confirmed around the same time as the ETF debut, supply-demand and fundamental catalysts could detonate simultaneously.
3. Quarterly Operating Profit Trend — From Red Ink to the 67T Era
SK Hynix’s earnings trajectory is a textbook semiconductor cycle recovery. After hitting a trough with operating losses of roughly 2 trillion KRW in Q1 2024, the company returned to profitability in Q3 2024 as HBM supply agreements fully kicked in.
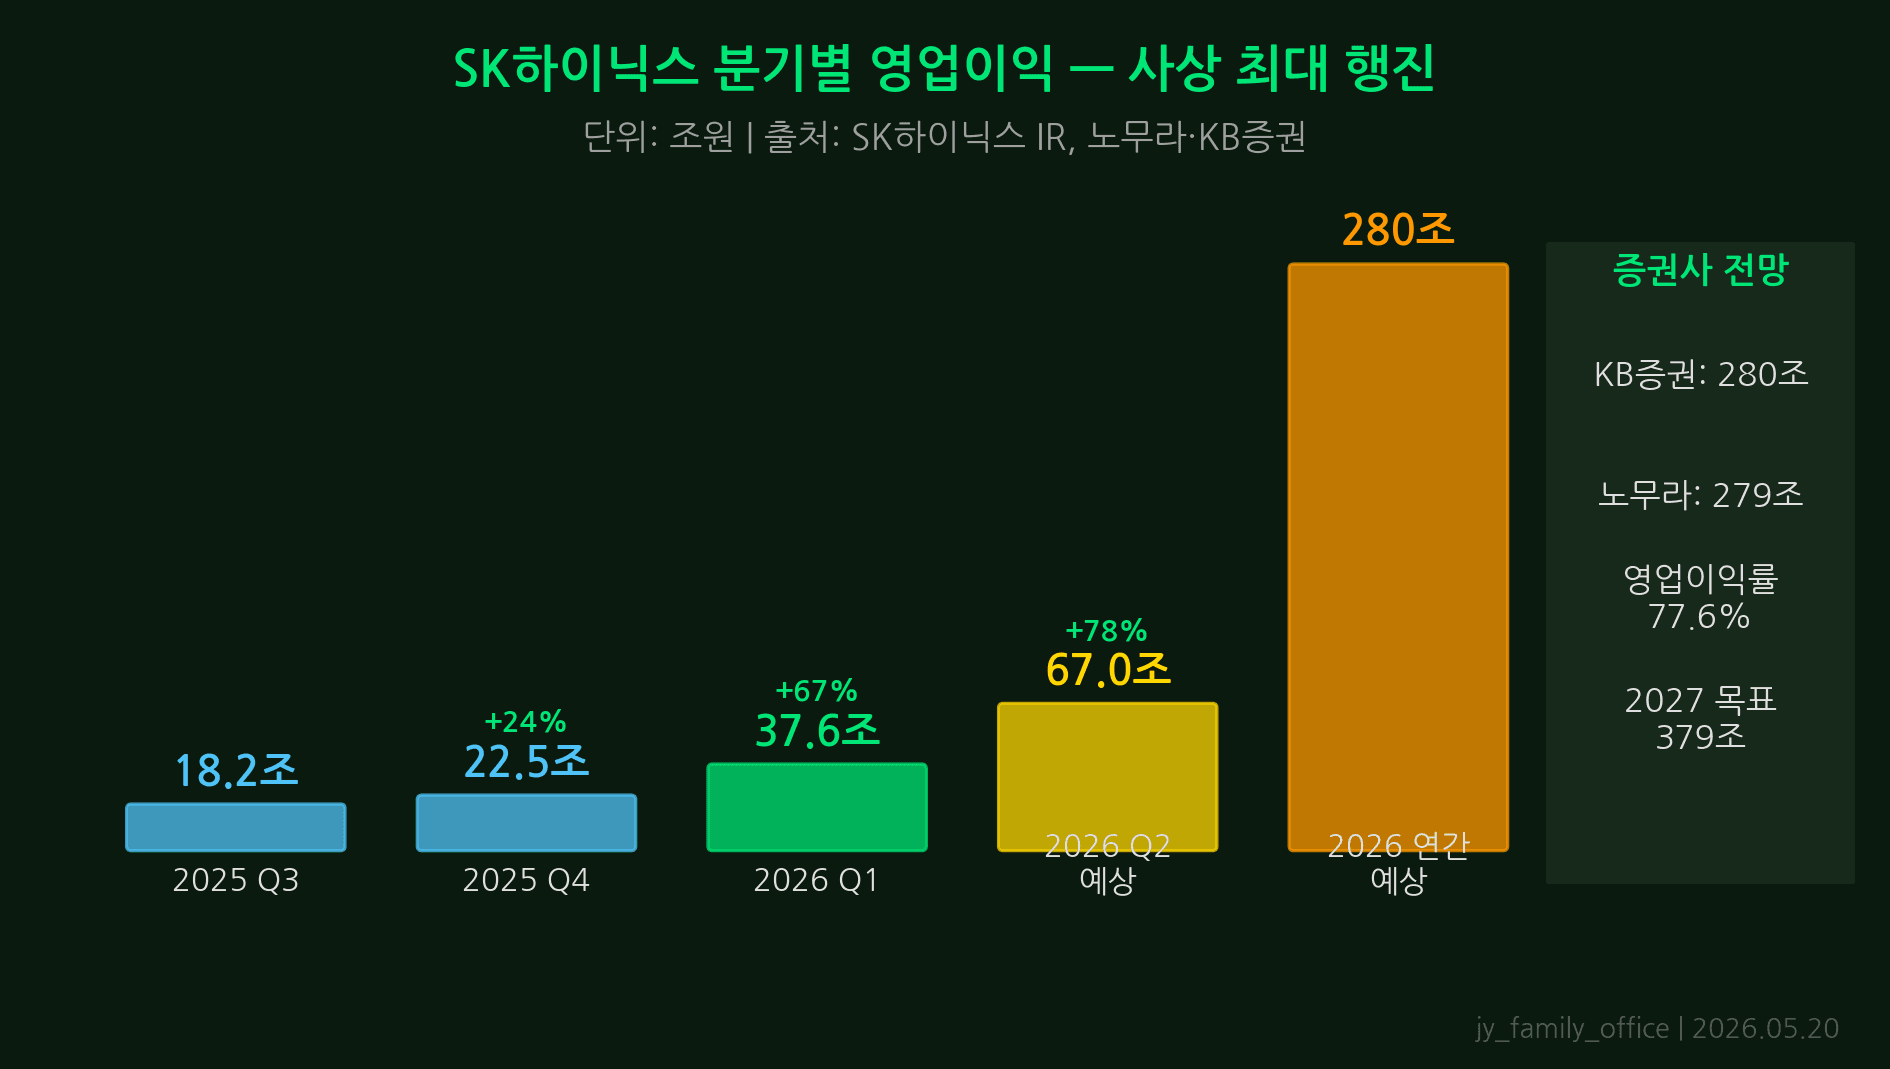
Full-year 2025 operating profit is estimated at approximately 38 trillion KRW, already surpassing the previous 2023 record. In 2026 another leap is expected. Broker consensus puts Q1 2026 operating profit at roughly 15 trillion KRW and Q2 at 17 trillion KRW, for an annual total approaching 67 trillion KRW — a 76% year-over-year increase.
The engine driving this growth is singular: HBM. The ASP (average selling price) of HBM3E 12-stack and 16-stack products is 5 to 8 times higher than commodity DDR5. SK Hynix’s HBM revenue mix is estimated to have already exceeded 50% of total DRAM revenue, with a projection to cross 60% in H2 2026. On profitability, HBM operating margins sit in the high 50% range — roughly double that of commodity DRAM.
4. Three Scenarios for 2M KRW — Probabilities and Conditions
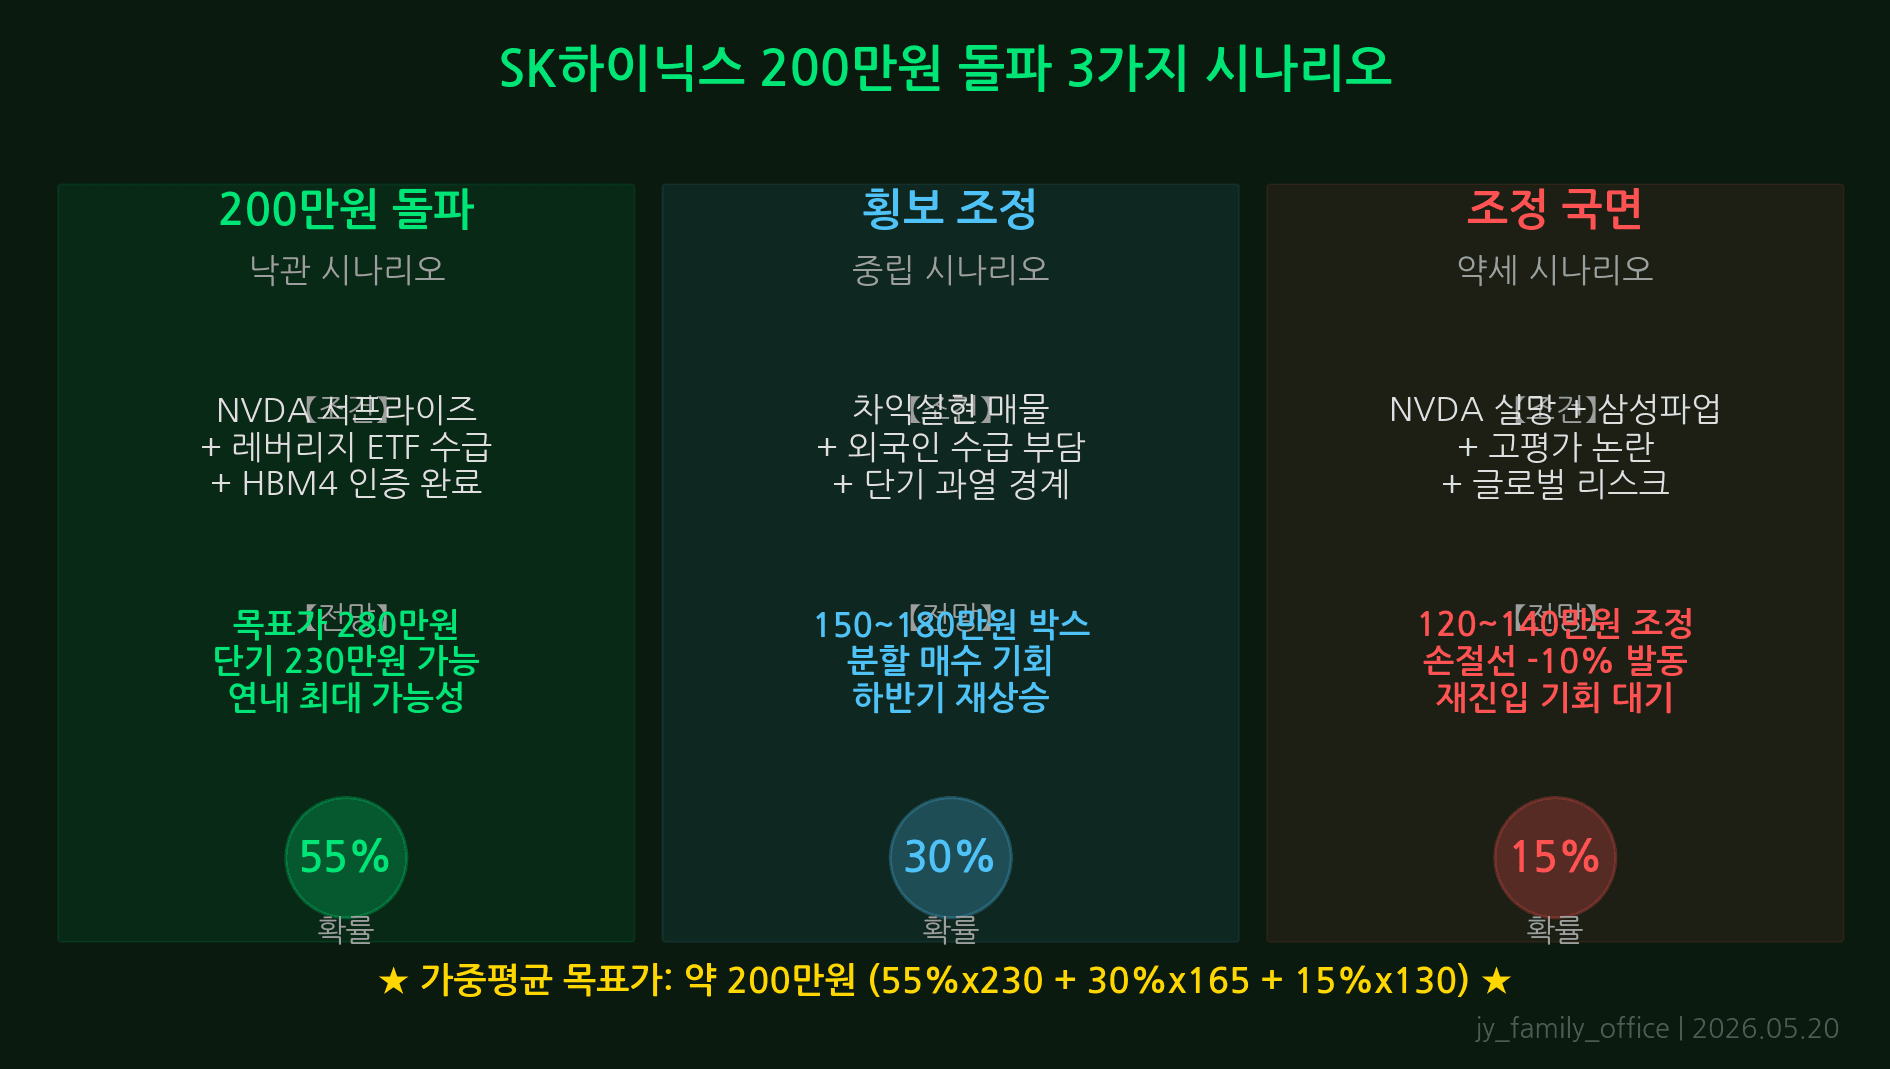
Our editorial team has synthesized available fundamental, technical, and macro data to construct three scenarios.
- Breakout Scenario (40% probability) — Q2 operating profit confirmed at 17 trillion KRW or above; May 22 leverage ETF inflows are orderly; Nvidia GB300 shipment acceleration continues; and the USD/KRW exchange rate stabilizes below 1,350 KRW. Target range: 2.0M–2.2M KRW, achievable within 2026.
- Range-Bound Scenario (40% probability) — Earnings are solid but Samsung Electronics raises expectations for HBM3E re-qualification, diluting SK Hynix’s valuation premium. Alternatively, post-ETF listing profit-taking limits upside. The share price oscillates in a 1.6M–1.85M KRW band, with the 2M KRW target deferred to H2 or beyond.
- Correction Scenario (20% probability) — U.S. semiconductor export controls tighten further, Nvidia misses earnings, or a macro shock (full tariff escalation, etc.) materializes concurrently. The near-term technical support at 1.4M KRW comes under pressure; a quarter-long drawdown is possible.
The key insight: at 40%+40%=80% probability, SK Hynix holds at or above current levels. The 20% correction scenario cannot be dismissed — but a clearly defined stop-loss strategy means investors need not forgo the 80% opportunity.
5. Samsung vs. SK Hynix — HBM Leadership Analysis
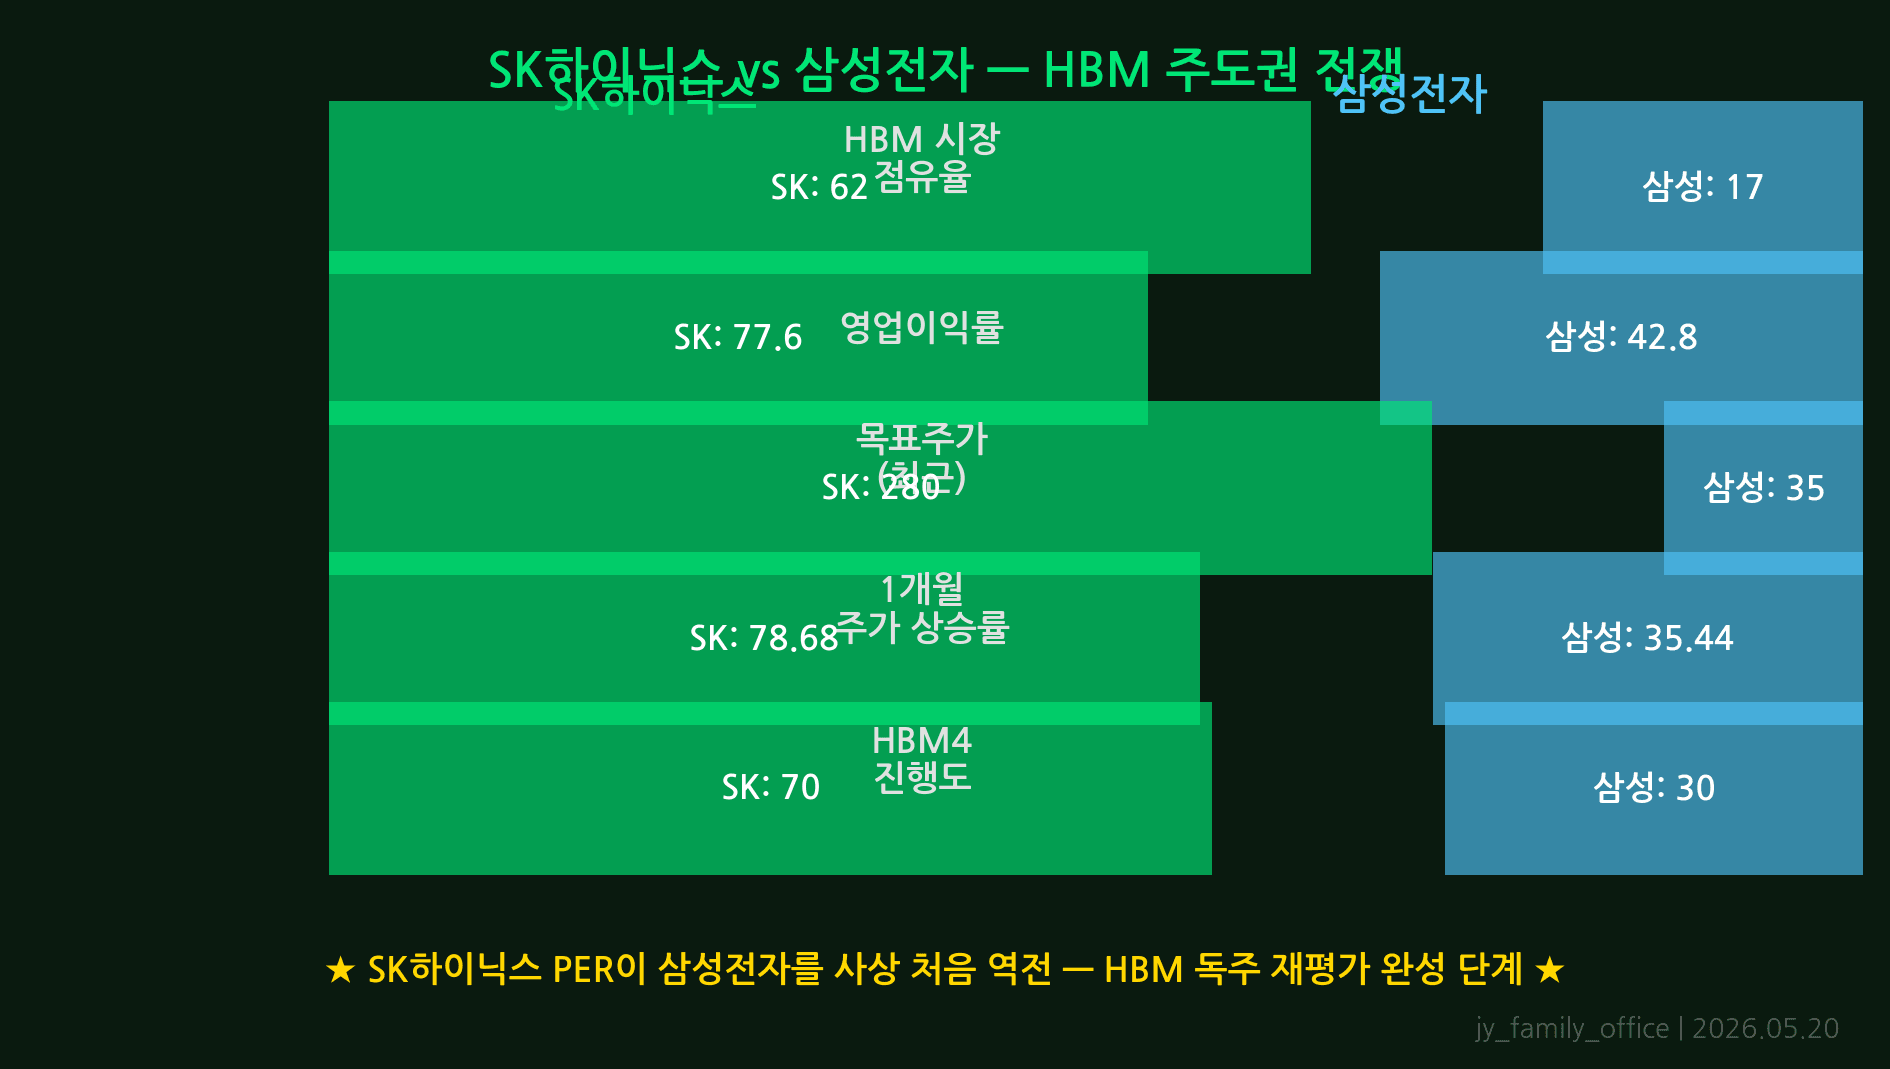
In the semiconductor industry Samsung Electronics is always SK Hynix’s most formidable threat. But in the HBM generation, the technology gap is wider and more persistent than the market expected. As of Q1 2026, HBM3E market share is estimated at SK Hynix approximately 72%, Micron approximately 18%, and Samsung Electronics approximately 10%.
Samsung’s 8-stack HBM3E product has passed Nvidia qualification, but its 12-stack yield remains in the 40% range, making large-volume supply untenable. SK Hynix’s 12-stack yield is already reported to be above 80%, and its 16-stack HBM4 development is on track for H2 2026 mass production.
Industry consensus holds that Samsung needs a minimum of two to three more quarters to emerge as a meaningful share competitor. During that window, SK Hynix will have another opportunity to widen the gap in the HBM4 generation. The argument that “Samsung catching up will break SK Hynix’s run” is difficult to apply within 2026.
6. AI Demand Structure — Agentic AI · Physical AI · Robot AI Triple Expansion
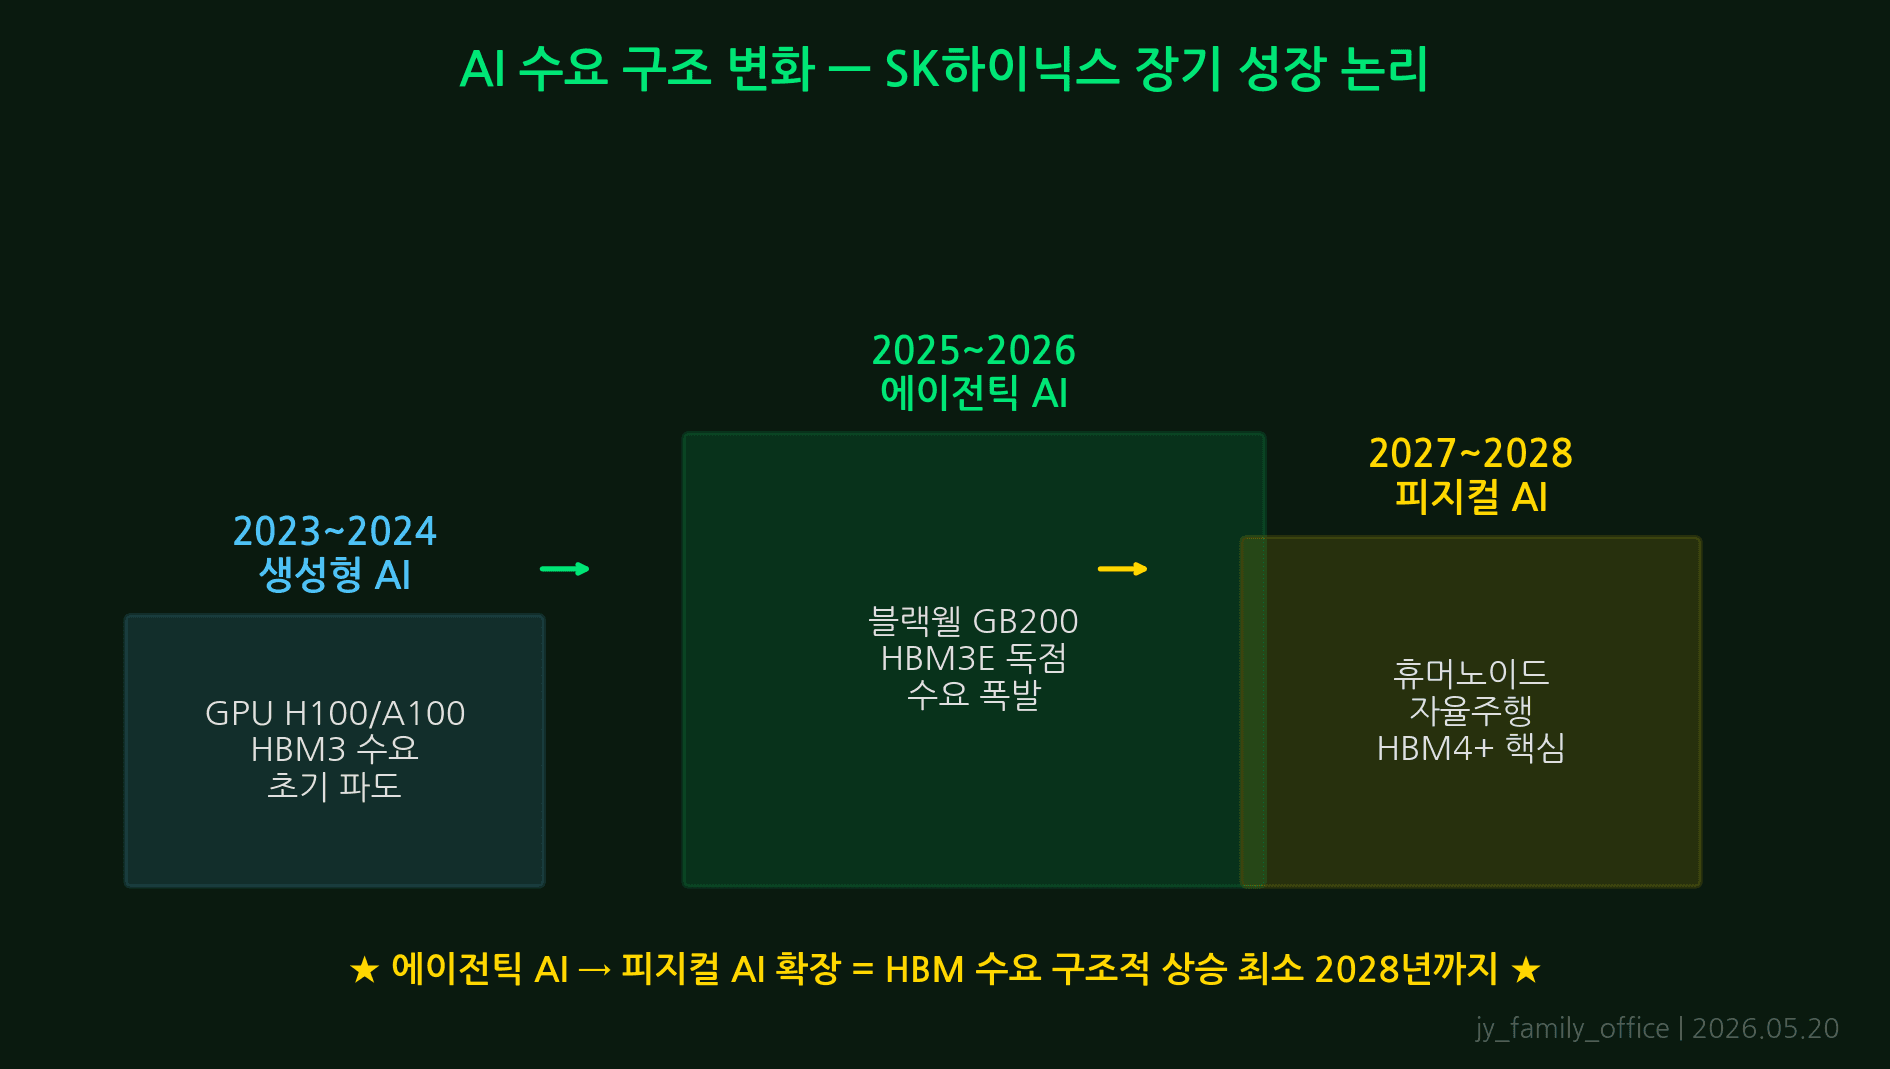
Many investors worry: “If the AI boom fades, won’t HBM demand collapse too?” The answer is no — because AI demand has already evolved from a single tier into a three-layer structure.
Layer 1 — Agentic AI: LLMs such as ChatGPT, Claude, and Gemini are evolving from simple chatbots into complex multi-step agents. A single agent requires 10 to 50 times more context (memory) than a standard inference call. This means HBM demand grows regardless of the number of model parameters.
Layer 2 — Physical AI: The AI brains inside robots being developed by Tesla Optimus, Hyundai Boston Dynamics, and Figure AI rely on the same HBM-based chip architectures used in data center GPUs. When physical AI enters mass production in 2027–2028, HBM demand is projected to expand by an additional 30–50%.
Layer 3 — Robot AI Infrastructure: When hundreds of thousands of robots need to synchronize and learn in real time, the demand for HBM-based inference chips bridging edge and data center explodes. This three-layer structure signals that HBM demand will expand structurally through at least 2030 — and SK Hynix is the single largest beneficiary.
7. Five Strategies for Investors — Including Stop-Loss at 1.4M KRW
The following five strategies reflect the editorial team’s synthesis of current data. All investment decisions and their outcomes are the sole responsibility of the investor. This content is provided for informational purposes only.
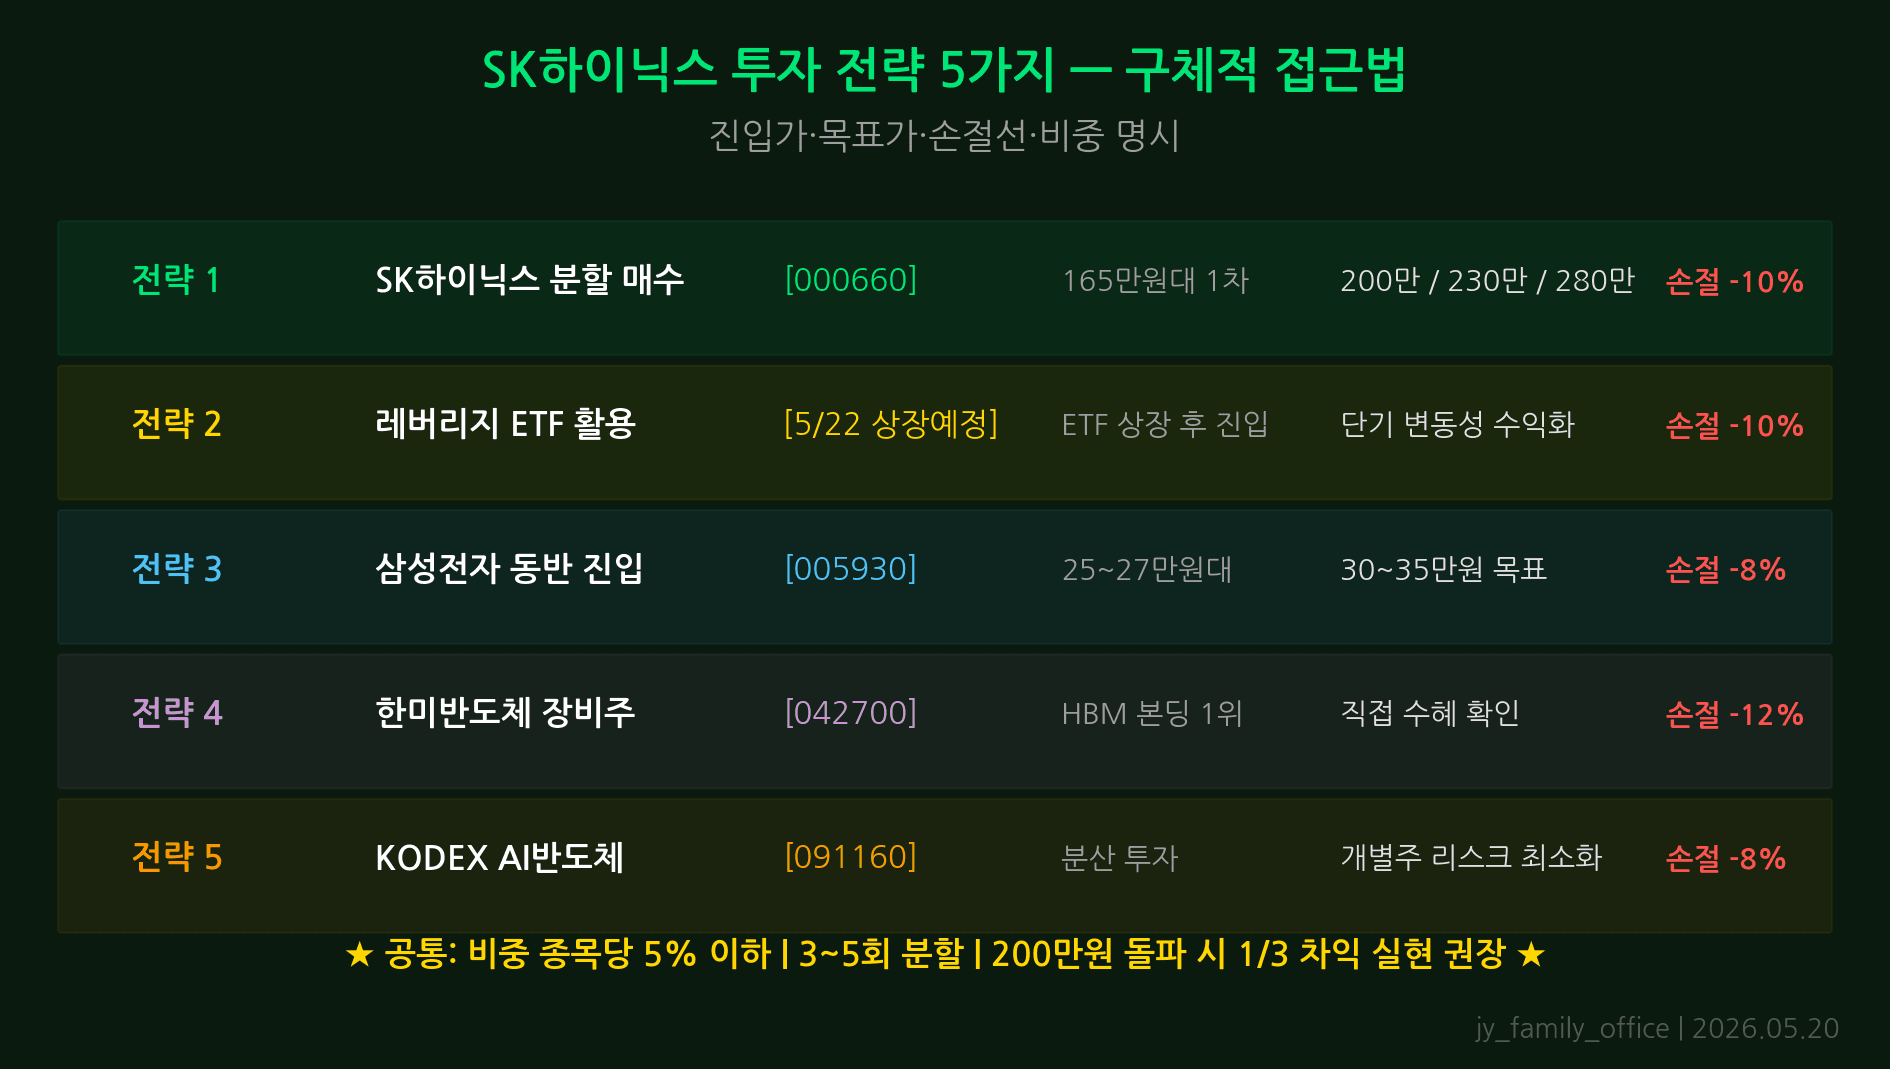
- Staged buying in SK Hynix shares: With meaningful upside remaining to the 2M KRW target, splitting your entry into 3–5 tranches is more effective for risk management than a lump-sum purchase. A reasonable structure: first tranche at current price, second at 5% below, third at 10% below.
- Watch-and-enter after the May 22 leverage ETF listing: Leverage ETFs typically exhibit high volatility immediately post-listing as short-term profit-takers exit. Waiting 3–5 trading days for price stabilization is likely to produce a more favorable entry. Note that leverage ETFs are better suited for short-term swing trading than long-term holding.
- Hanmi Semiconductor (042700) as a partial hedge: As SK Hynix scales HBM production, demand for TC bonding equipment grows proportionally. Hanmi Semiconductor provides relative downside protection when SK Hynix weakens and amplifies returns when SK Hynix rallies. A 10–15% portfolio allocation as a hedge is a reasonable approach.
- Enforce the stop-loss at 1.4M KRW: To prepare for the 20% correction scenario, pre-set a stop-loss at 1.4 million KRW. A mechanical stop-loss consistently outperforms psychological endurance in terms of long-term portfolio survival. The 1.4M KRW level aligns with key technical support around the Q1 2026 earnings announcement window.
- Add on after Nvidia’s earnings report: If Nvidia’s quarterly results (expected late May) show data center revenue beating consensus, it signals accelerating SK Hynix HBM demand — use that as an add-on buy signal. Conversely, a Nvidia miss is a cue to stand aside in the short term.
8. Five Key Risks — What Could Block the 2M KRW Target
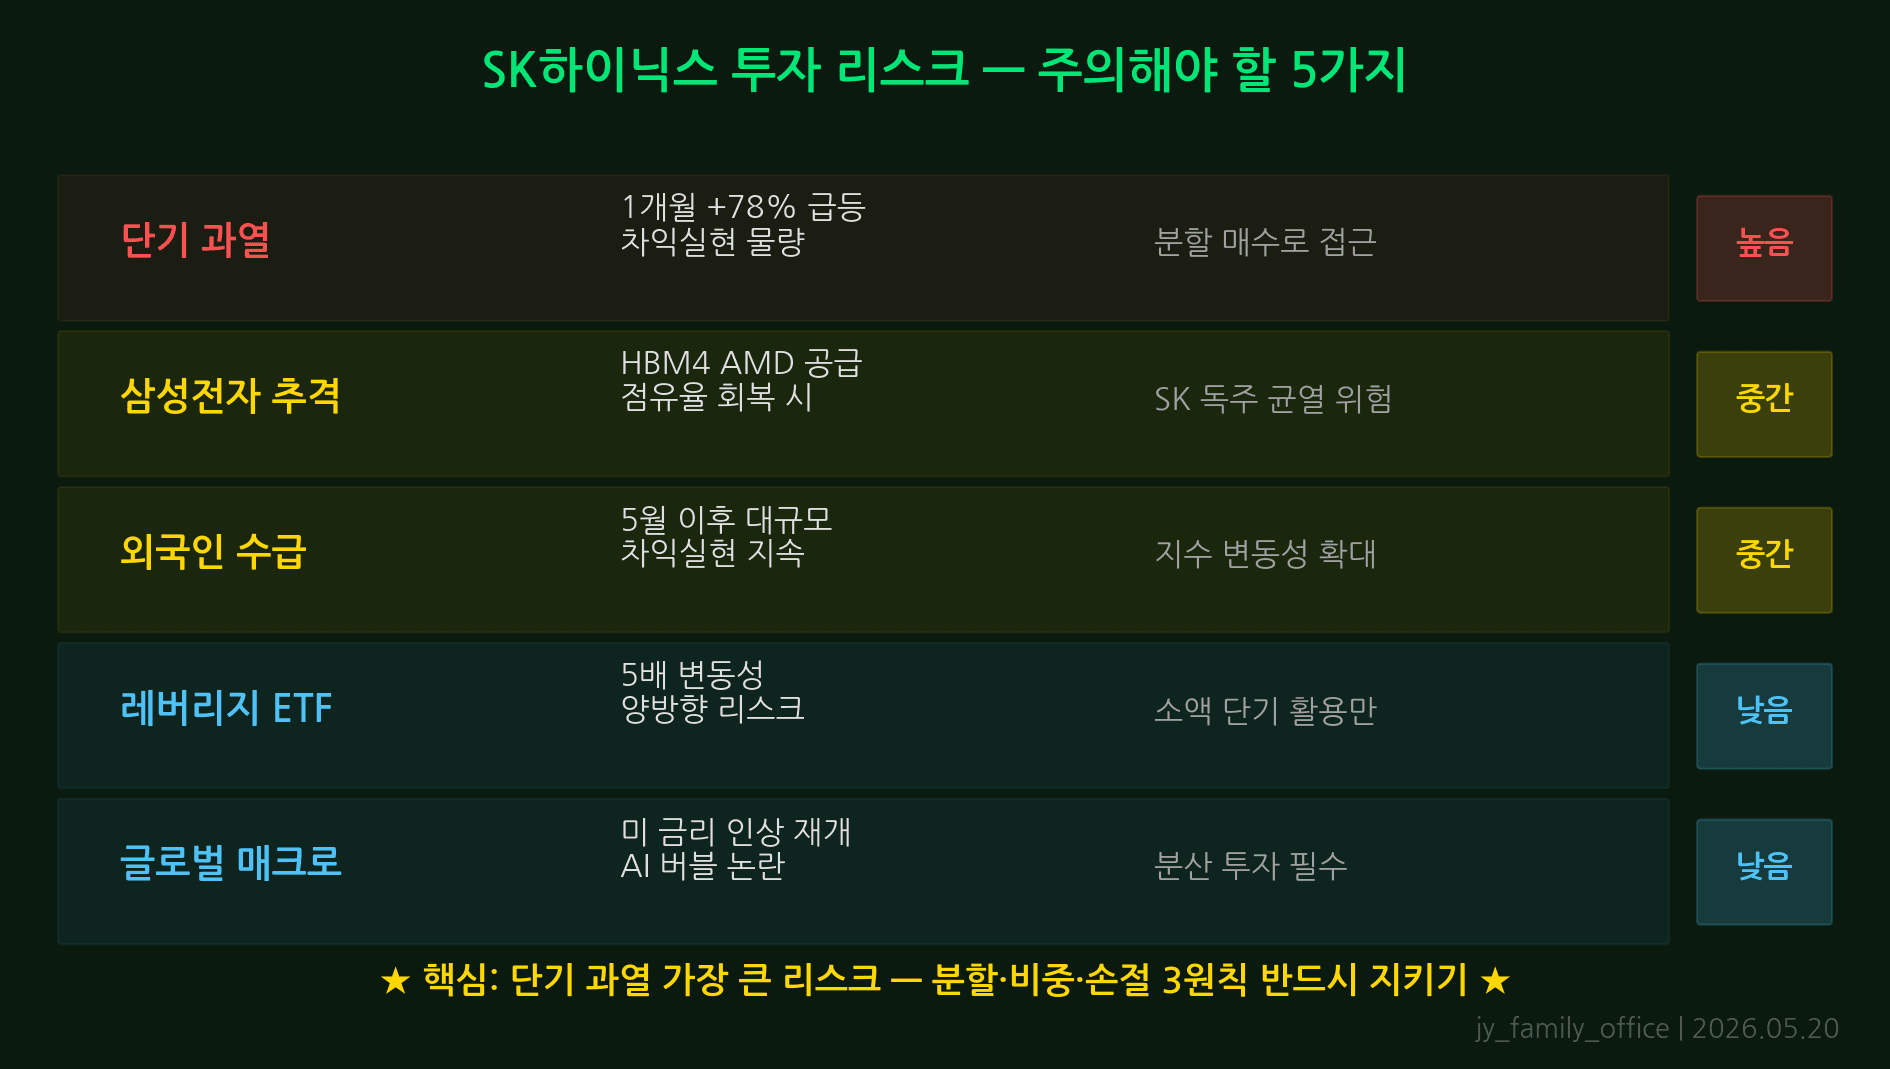
The more attractive the bull case, the more rigorously risks must be assessed. Here are the five risks most capable of blocking SK Hynix’s 2M KRW target.
- Samsung Electronics’ HBM catch-up: If Samsung rapidly lifts its HBM3E 12-stack yield to 70% or above, Nvidia will face pressure to diversify its supply chain, diluting SK Hynix’s monopoly premium. This risk becomes more material from Q4 2026 onward.
- China’s semiconductor self-reliance drive: Chinese memory makers CXMT and CXMT are accelerating HBM development. If Chinese AI companies begin adopting domestically made HBM, global HBM market growth rates could moderate. That said, the technology gap is estimated at three to five years, limiting the near-term threat.
- U.S. additional semiconductor export controls: Should the U.S. impose direct restrictions on Korean HBM exports to China, SK Hynix’s revenue diversification strategy would take a hit. While SK Hynix’s China-bound HBM share is currently minimal, broadened regulatory scope could suppress market sentiment.
- KRW/USD exchange rate swings: HBM is priced in USD, so KRW appreciation (lower exchange rate) directly reduces KRW-denominated earnings. A drop to below 1,300 KRW per USD could result in a 2–3 trillion KRW downward revision to consensus operating profit.
- Leverage ETF volatility amplification: The leverage ETF listing on May 22 tracks 2× daily returns. A large concentrated retail inflow can widen the stock’s intraday price swings, triggering stop-losses earlier than anticipated. Simultaneous mass redemption of leverage ETFs can also cause sharp declines in the underlying stock.
9. Bottom Line — 40% Chance at 2M KRW, Stop-Loss at 1.4M, Watch May 22 ETF Day 1
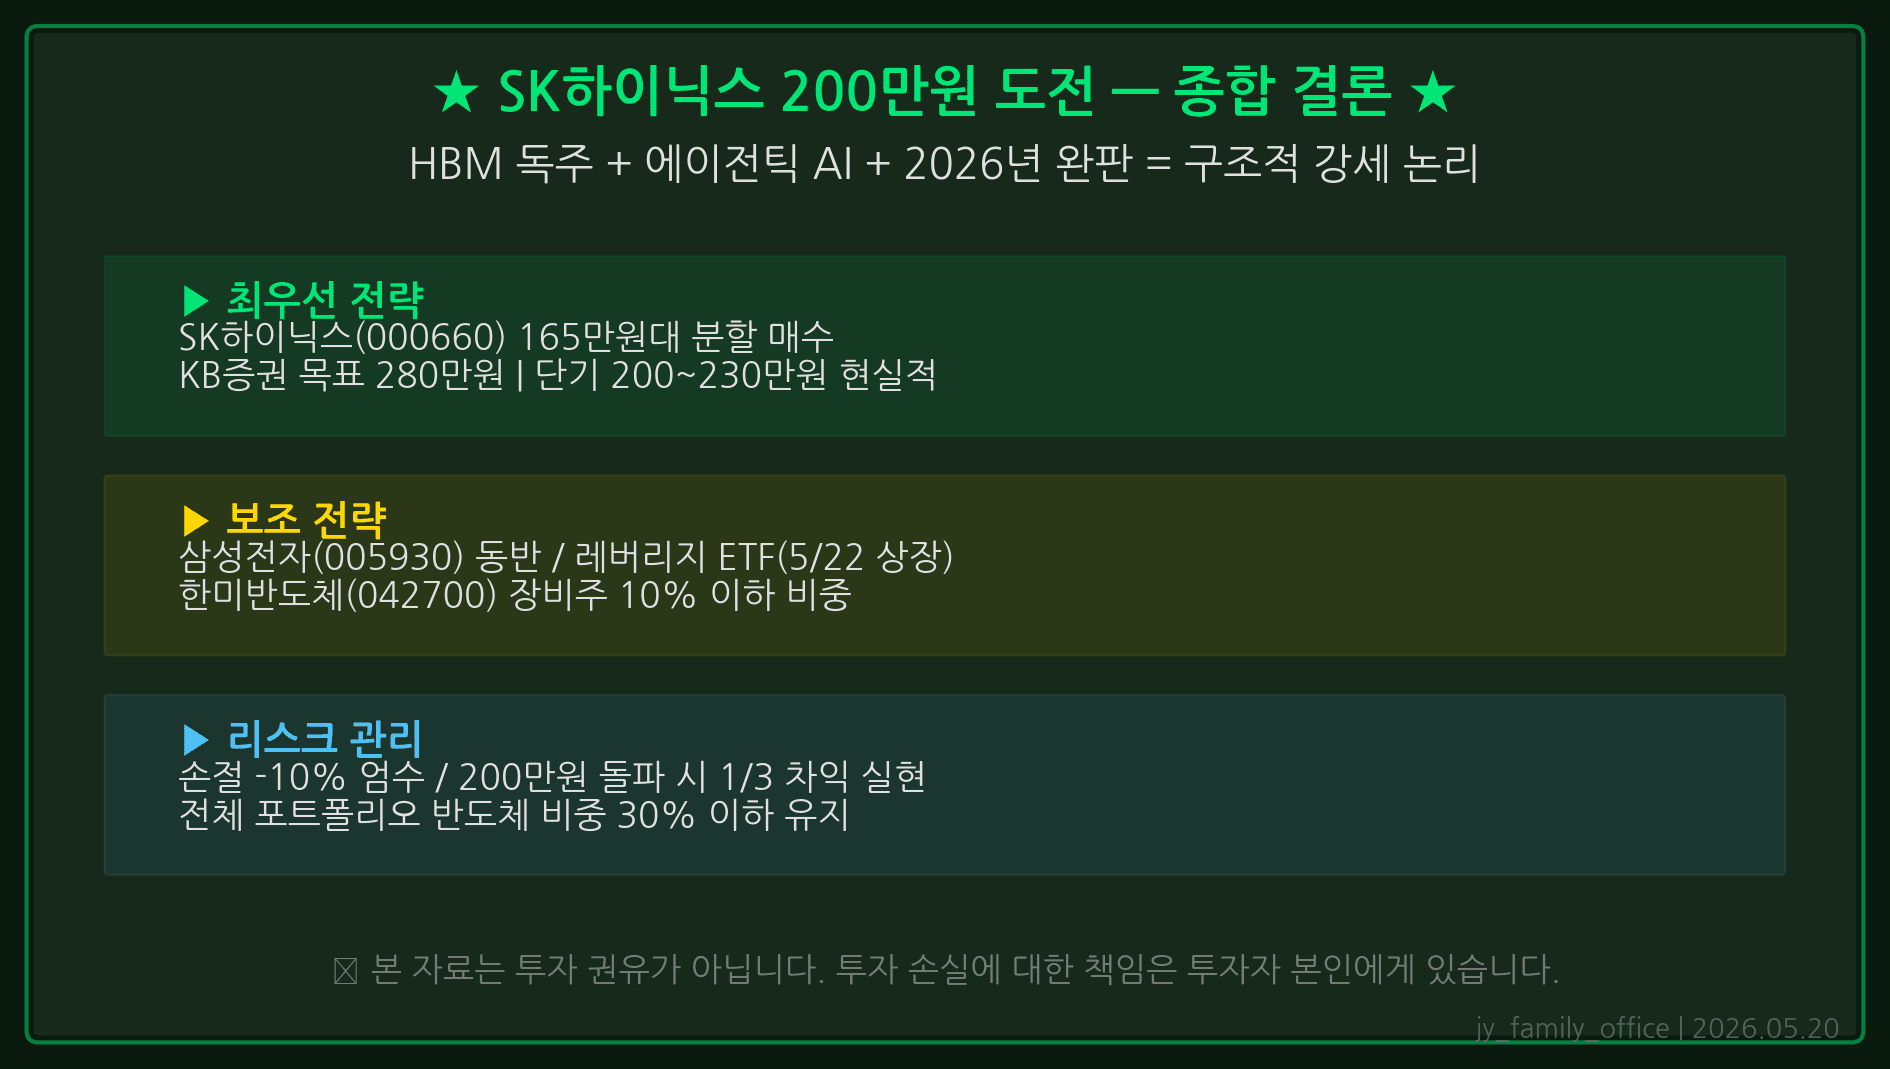
In 2026, SK Hynix possesses the strongest earnings visibility and the deepest technology moat in the global semiconductor industry simultaneously. A 40% probability of reaching the 2M KRW target is not low. The HBM monopoly, Q2 operating profit of 17 trillion KRW, and the 67-trillion KRW annual guidance all support this outlook.
Investing is, however, always a game of probabilities. Setting a stop-loss at 1.4M KRW in advance and preparing for the 20% correction scenario is the cornerstone of long-term portfolio survival. The May 22 leverage ETF listing day is likely to be extremely volatile, so the rational approach is to stand aside on day one and initiate or add positions after stabilization 3–5 trading days later.
Nvidia’s late-May earnings release will determine the next directional move in SK Hynix’s share price. If data center revenues beat expectations, the path to 2M KRW accelerates; if Nvidia misses, the dip becomes a buying opportunity. Disciplined staged buying and mechanical stop-loss execution are the most reliable tools for navigating this high-volatility environment.
※ This content is provided for informational purposes only and does not constitute a recommendation to buy or sell any specific security. All investment decisions and their resulting gains or losses are the sole responsibility of the investor.