US 30-Year Treasury Breaks 5% — First in 18 Years, 2007 GFC Comparison, 5 Implications + 7 Risks + Korean Investor Strategy
Real-Time Issue · May 19, 2026
US 30-Year Treasury Breaks 5% — First time in 18 years. 2007 GFC comparison, 5 key implications + 7 risks + S&P P/E -25% pressure + Korean KOSPI foreign selling analysis. Korean investor strategy for June 17 FOMC D-30.

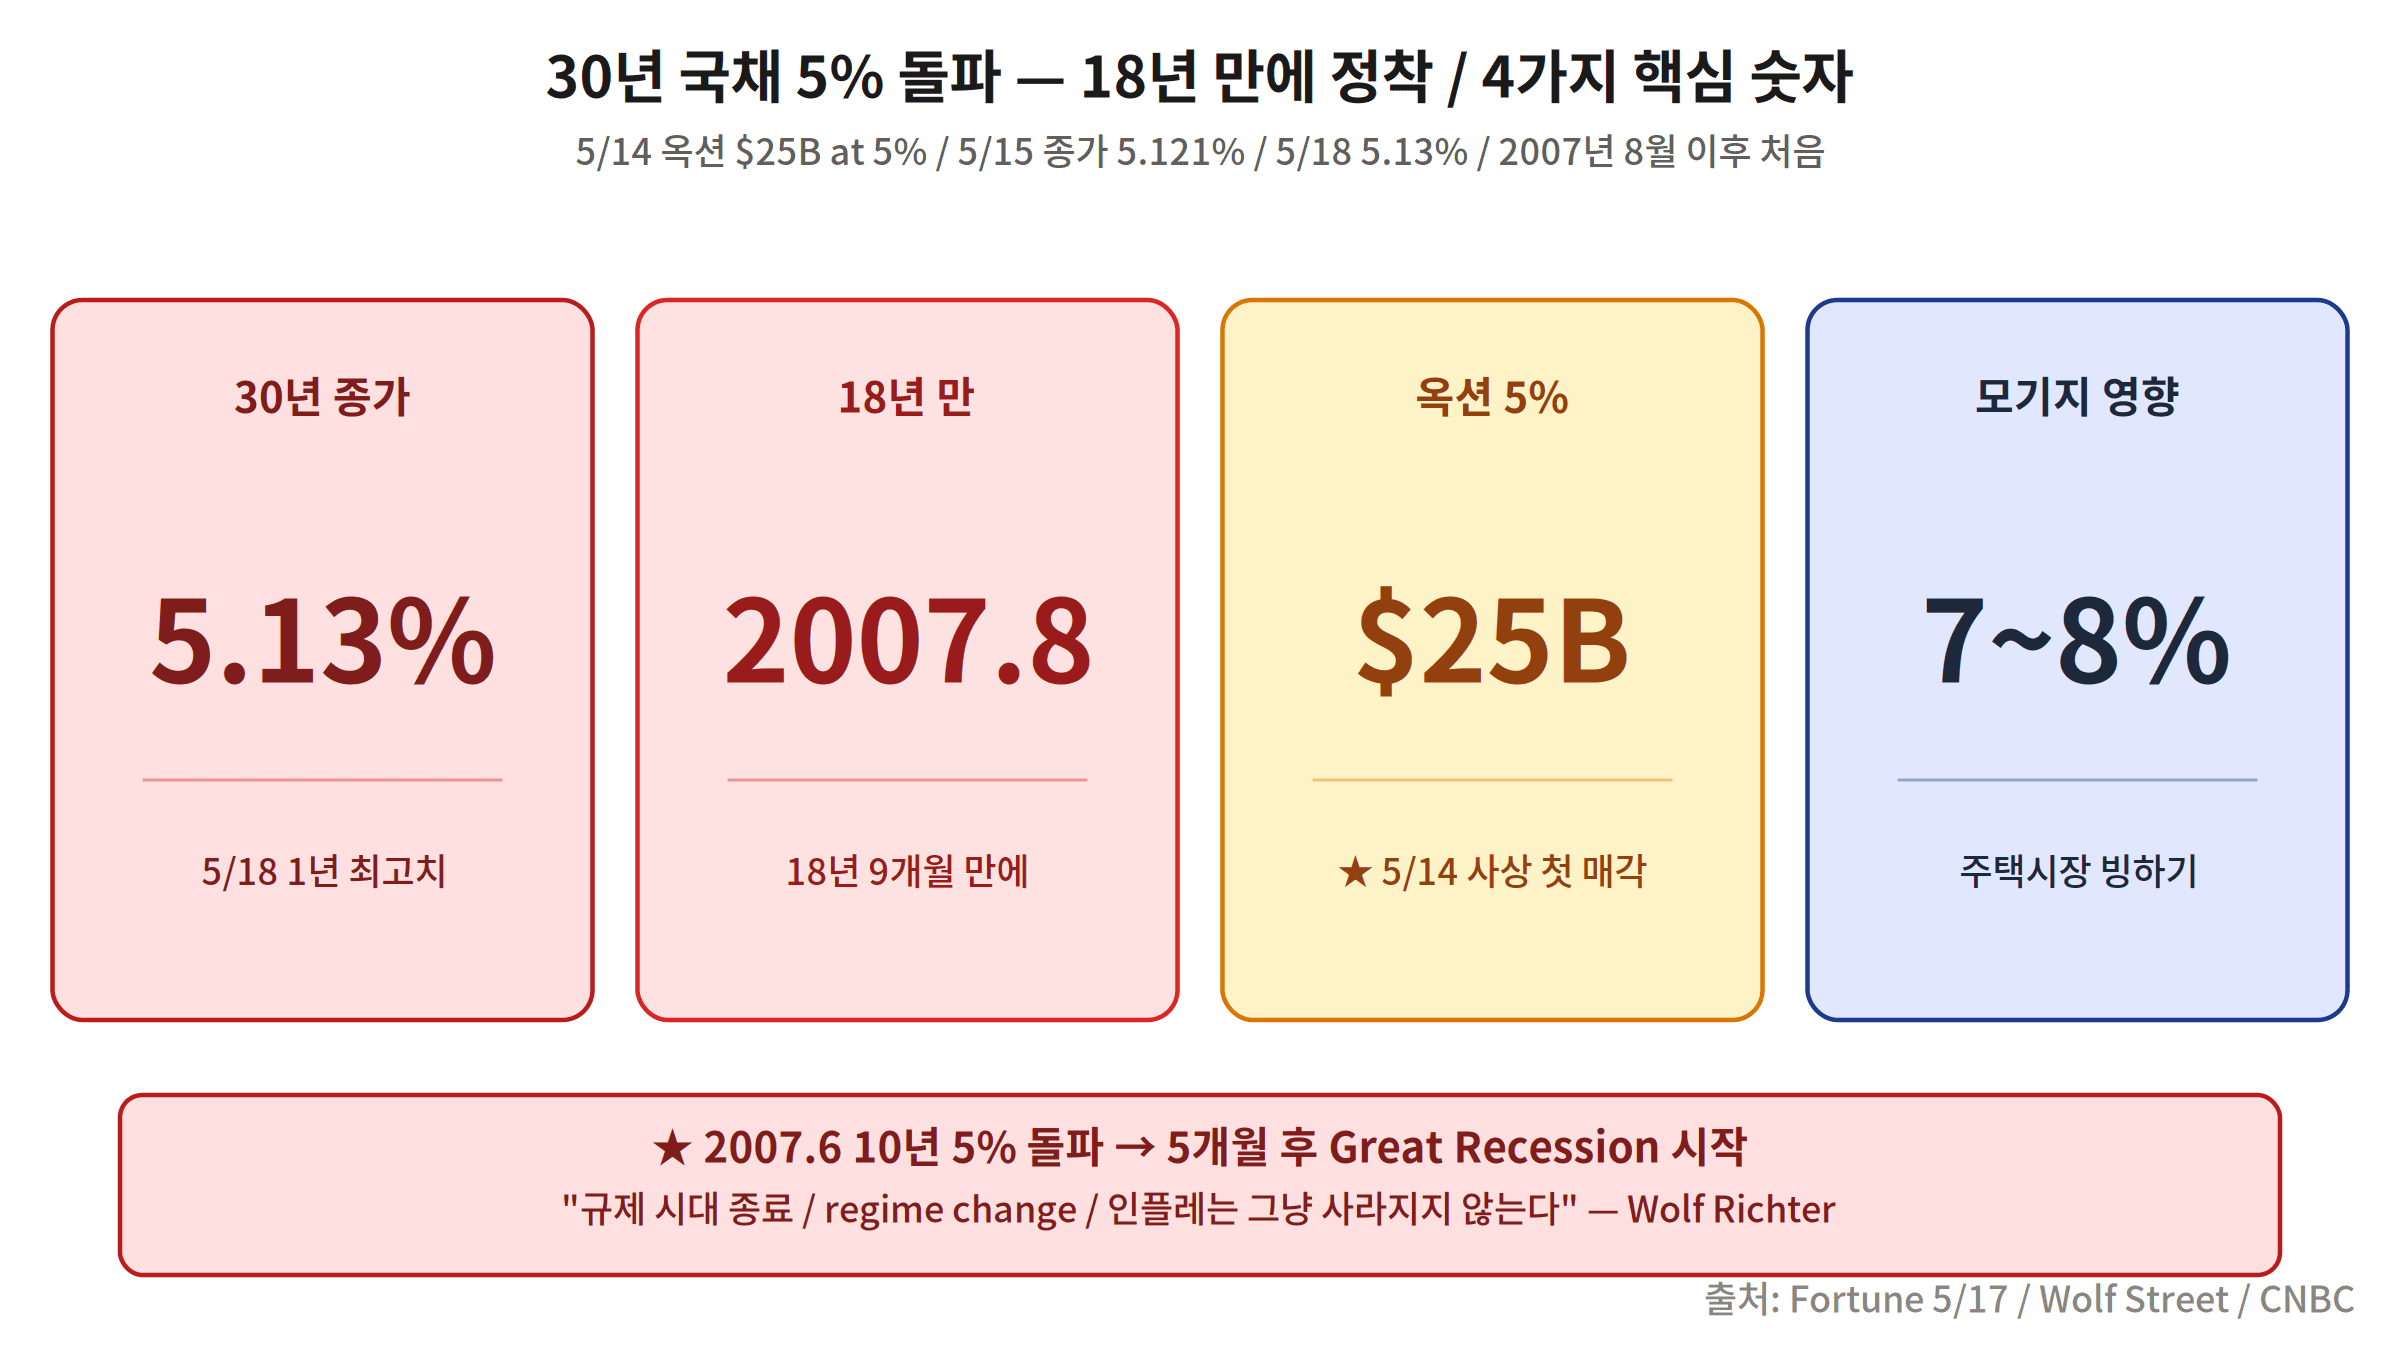
On May 14, 2026, the US Treasury’s $25B 30-year bond auction cleared at exactly 5.0% — the first time since August 2007, an 18-year, 9-month gap. By May 15 close it was 5.121%, and by May 18 it had settled at 5.13%. Wolf Street’s Wolf Richter called it a “Bond Bloodbath — all prior assumptions are out the window.” Markets are rattled by the historical parallel: the 10-year broke 5% in 2007, and just five months later the Great Recession began.
US 30-Year Treasury 18-Year Trend — 2007 vs 2023 vs 2026
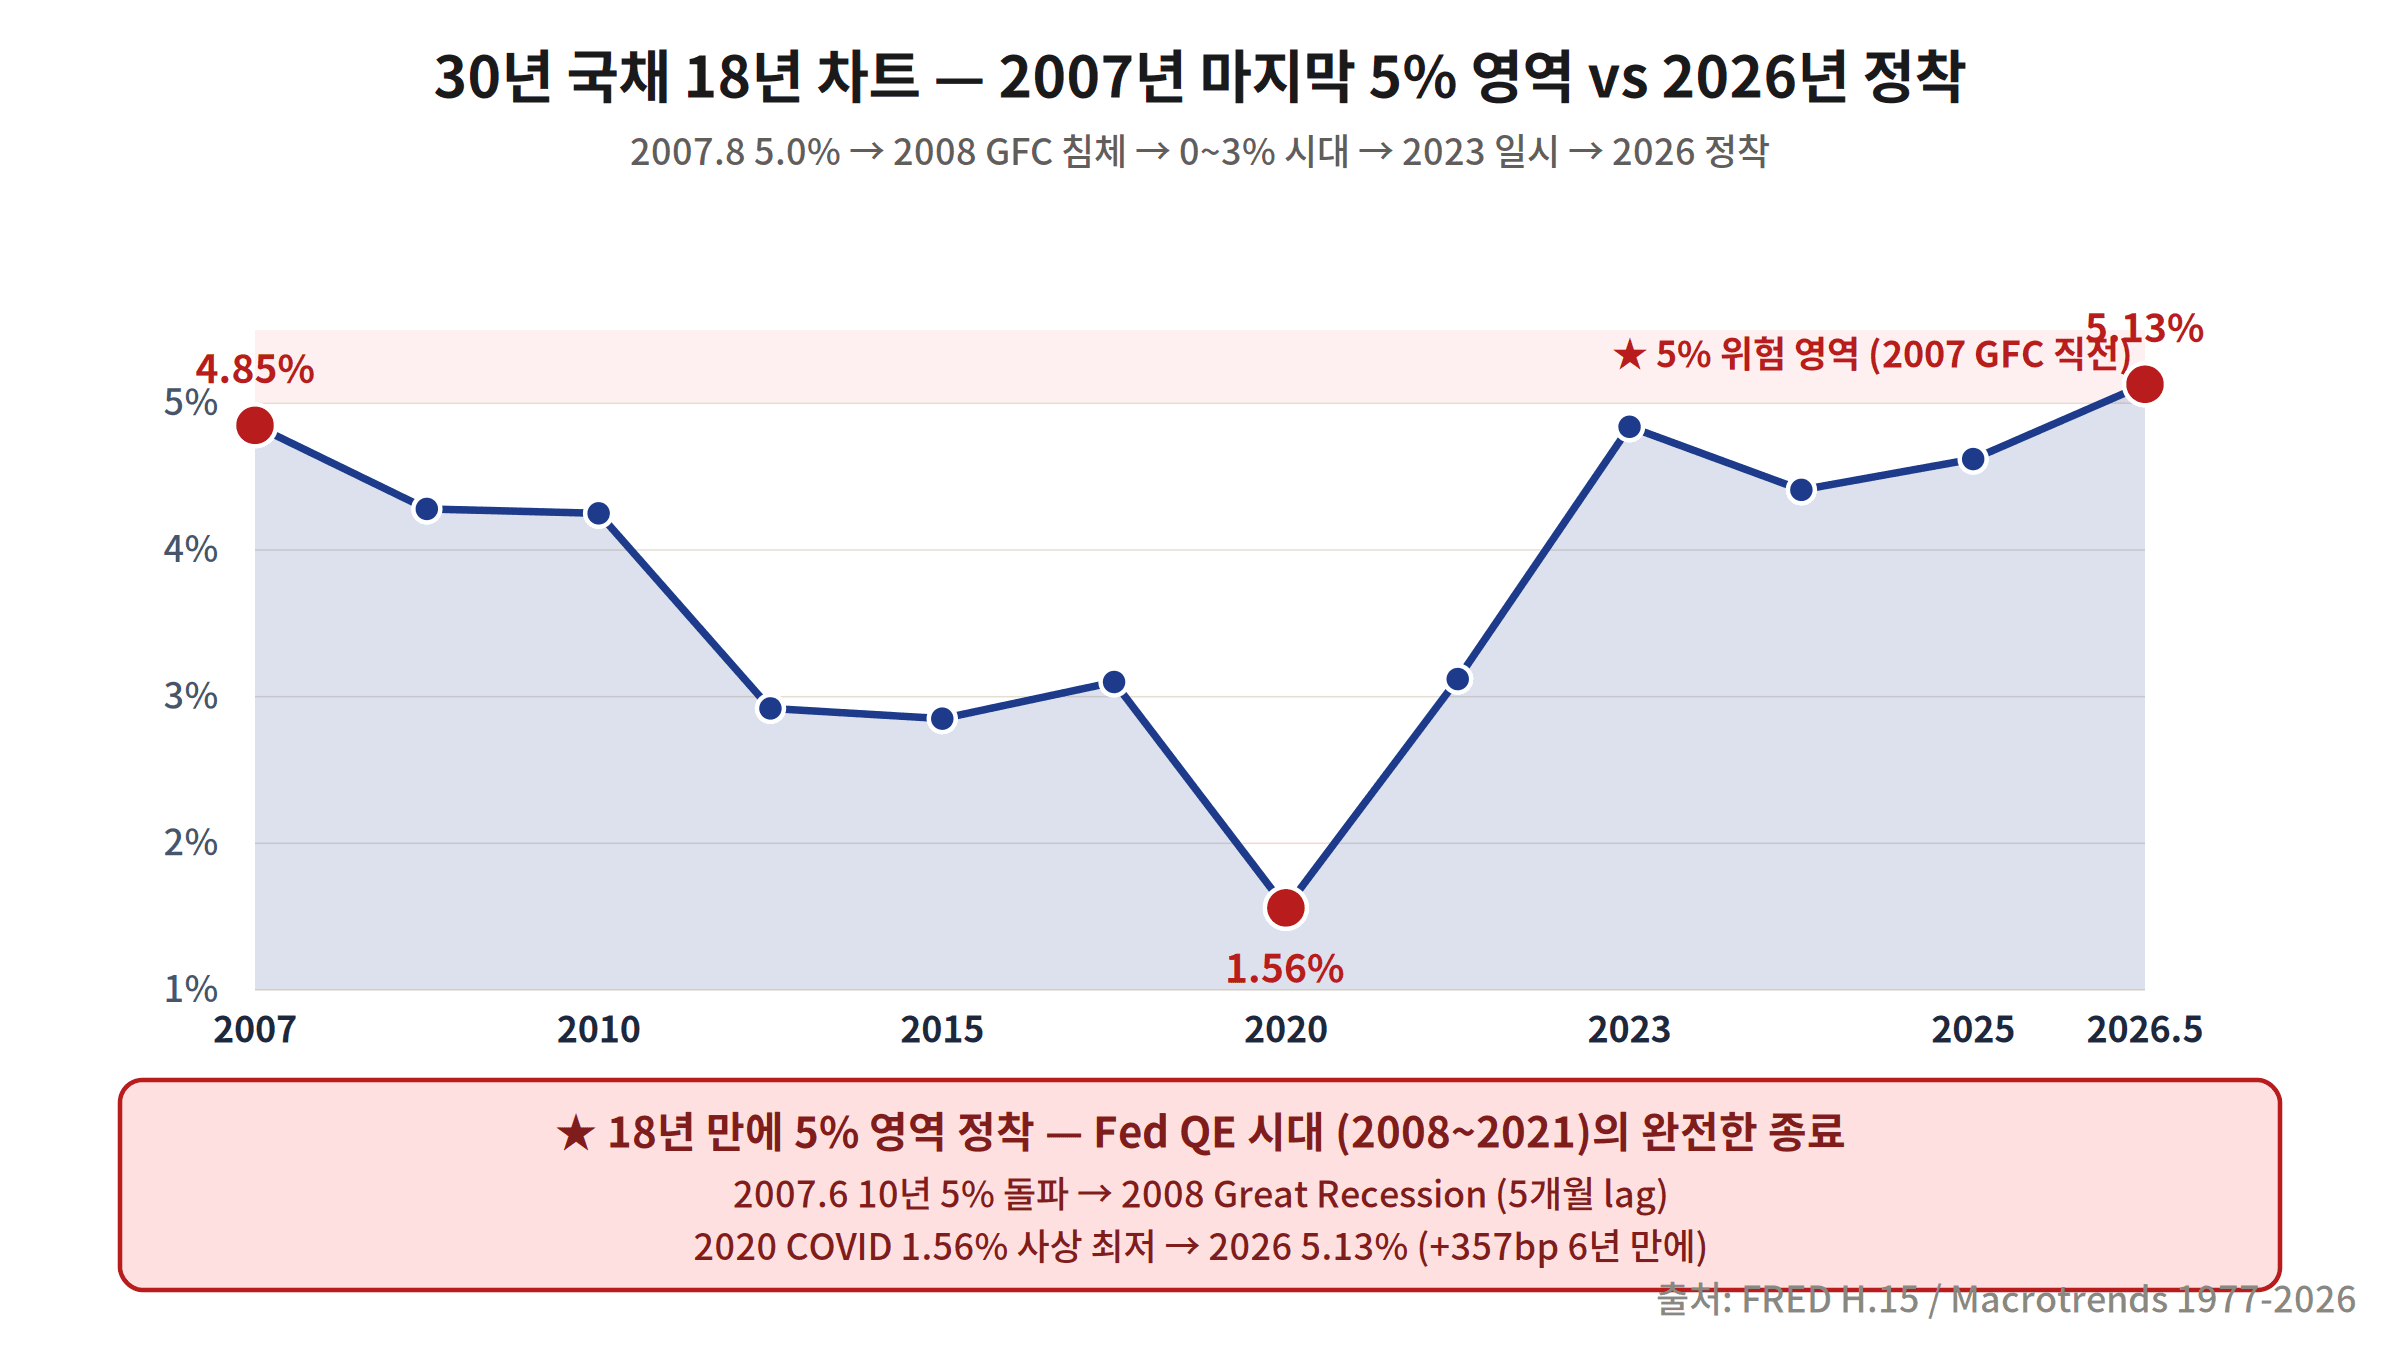
2007’s last 5% zone → 2008–2021 Fed QE zero-rate era (1.56% COVID low) → 2022 inflation surge recovery to 3% → October 2023 brief 5% breach then retreat to 4% → 2026 settlement above 5%. The 1990–2007 average was 5.2%, meaning the ultra-low rate era was the aberration. We are simply returning to normal.
5 Key Implications of the US 30-Year Treasury Breaking 5%
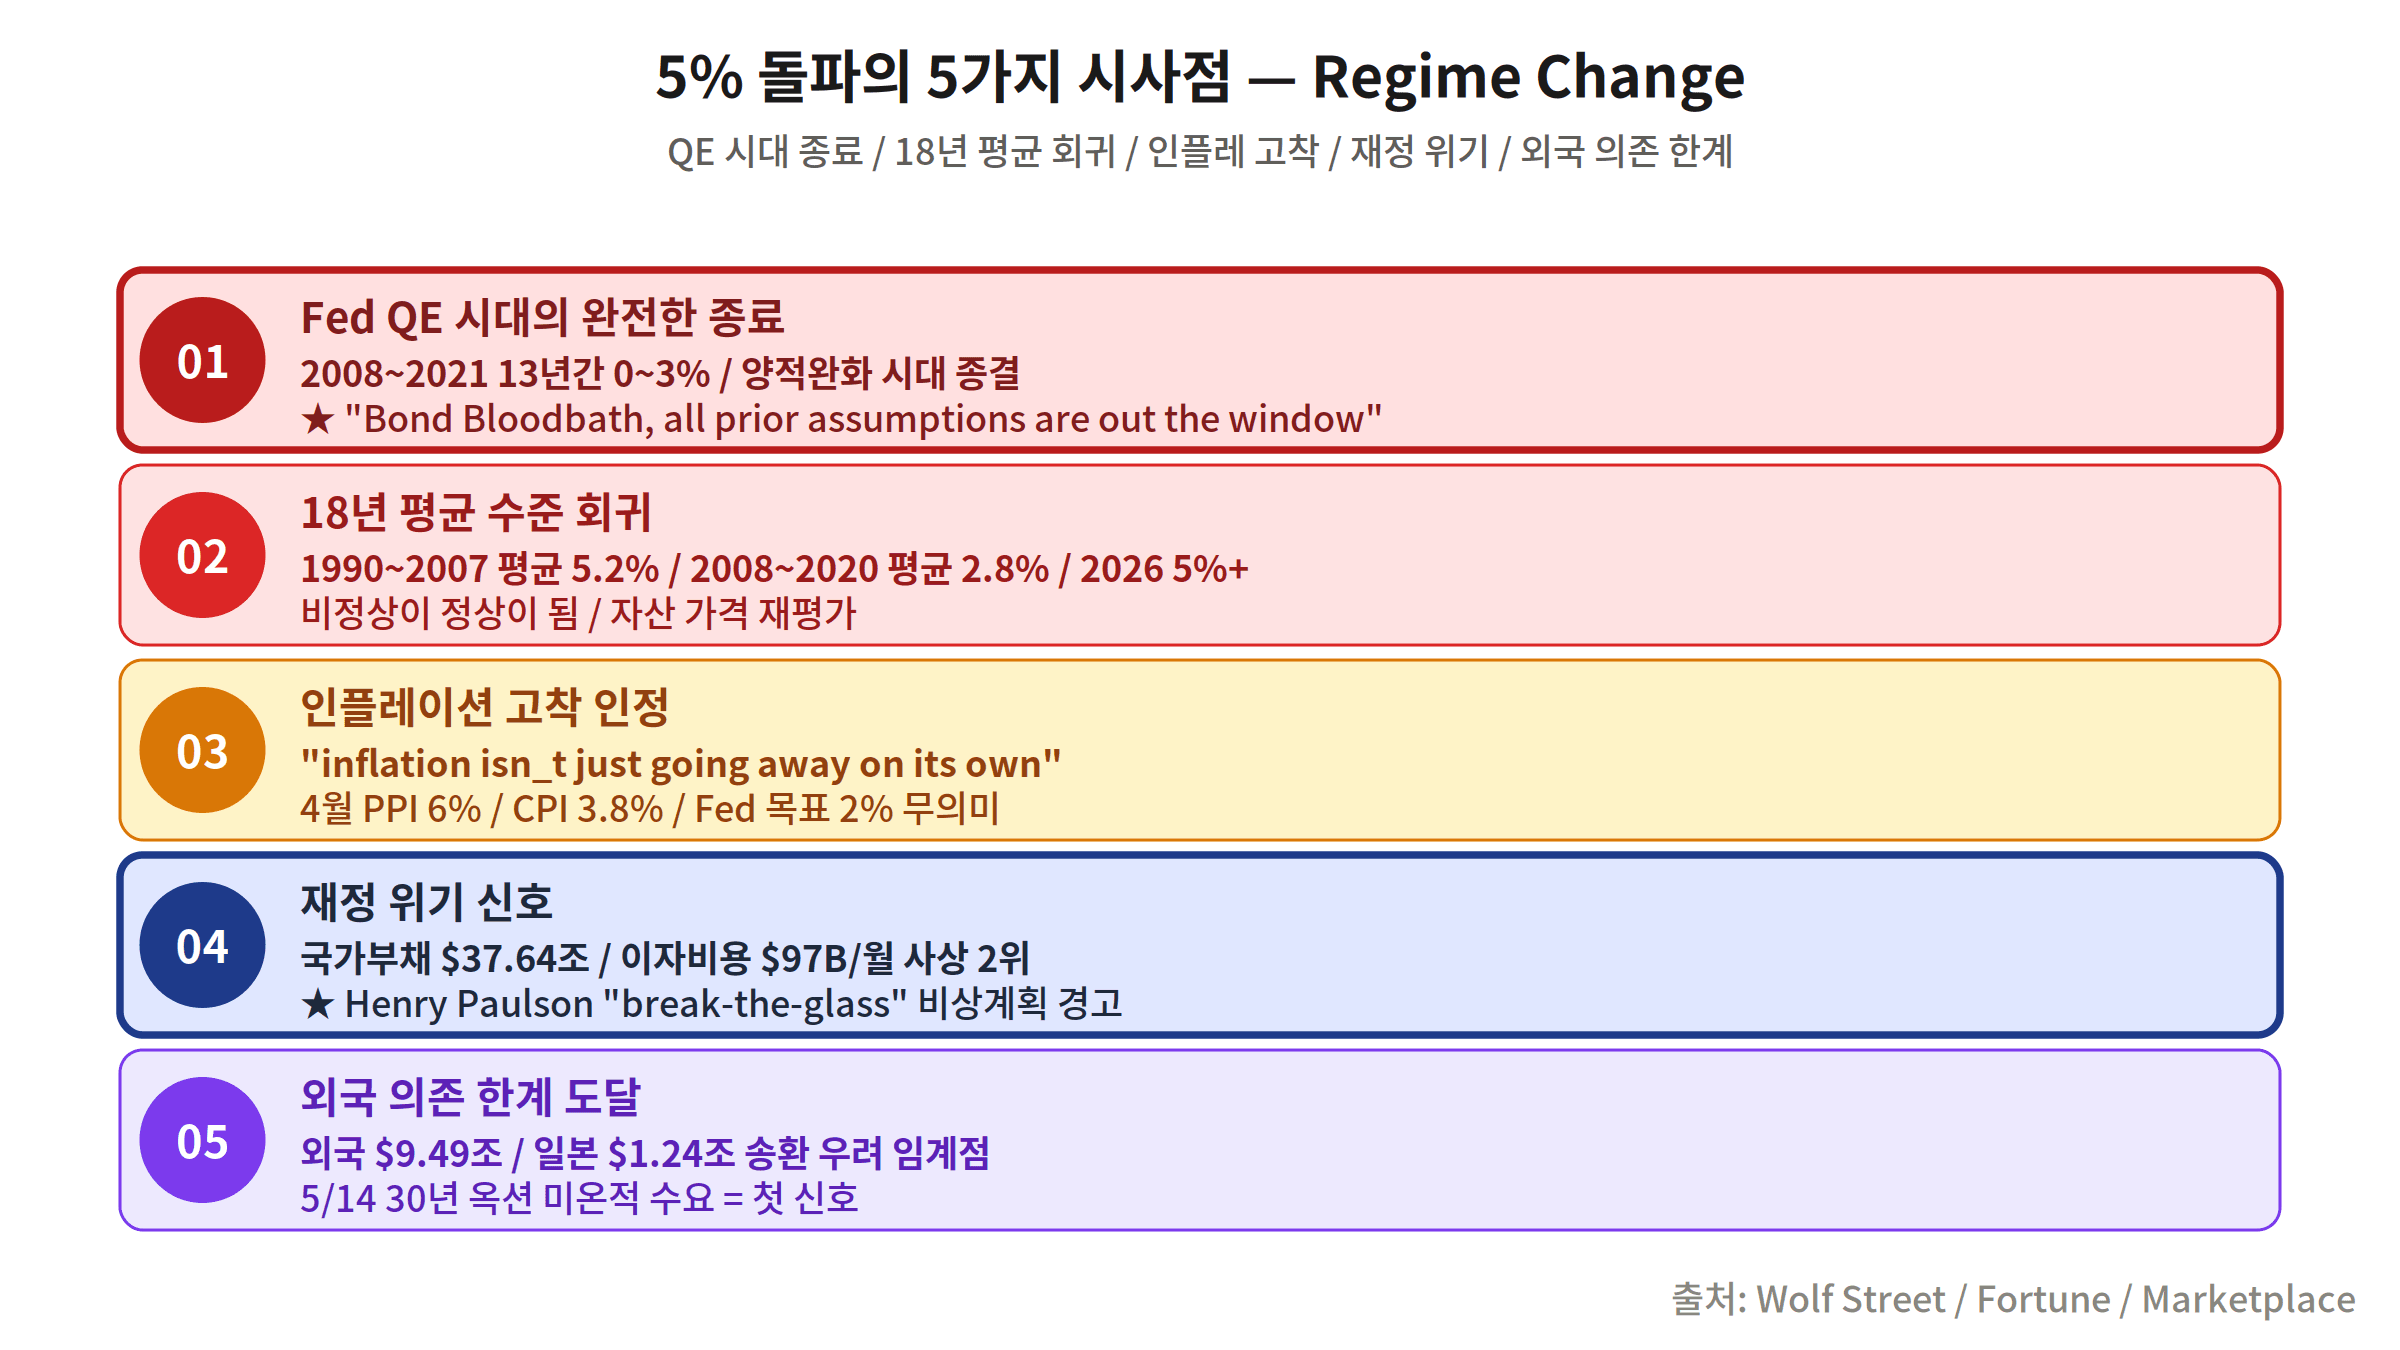
- Complete end of the Fed QE era: The 2008–2021 thirteen-year low-rate era is over. All prior asset price assumptions are invalidated.
- Reversion to 18-year average: The 1990–2007 30-year average was 5.2%. The 2008–2020 average of 2.8% was the anomaly.
- Acknowledgment of entrenched inflation: April PPI 6% + CPI 3.8%, May CPI likely 5–6%. “Inflation isn’t going away on its own.”
- Fiscal crisis signal: National debt $37.64T + interest costs $97B/month (2nd largest expense after Social Security). Former Treasury Secretary Henry Paulson warns of “break-the-glass” emergency plans.
- Foreign dependency limit reached: Foreign holdings at record $9.49T but May 14 auction showed tepid demand. Japan’s $1.24T potential repatriation is the key variable.
7 Risks Ahead
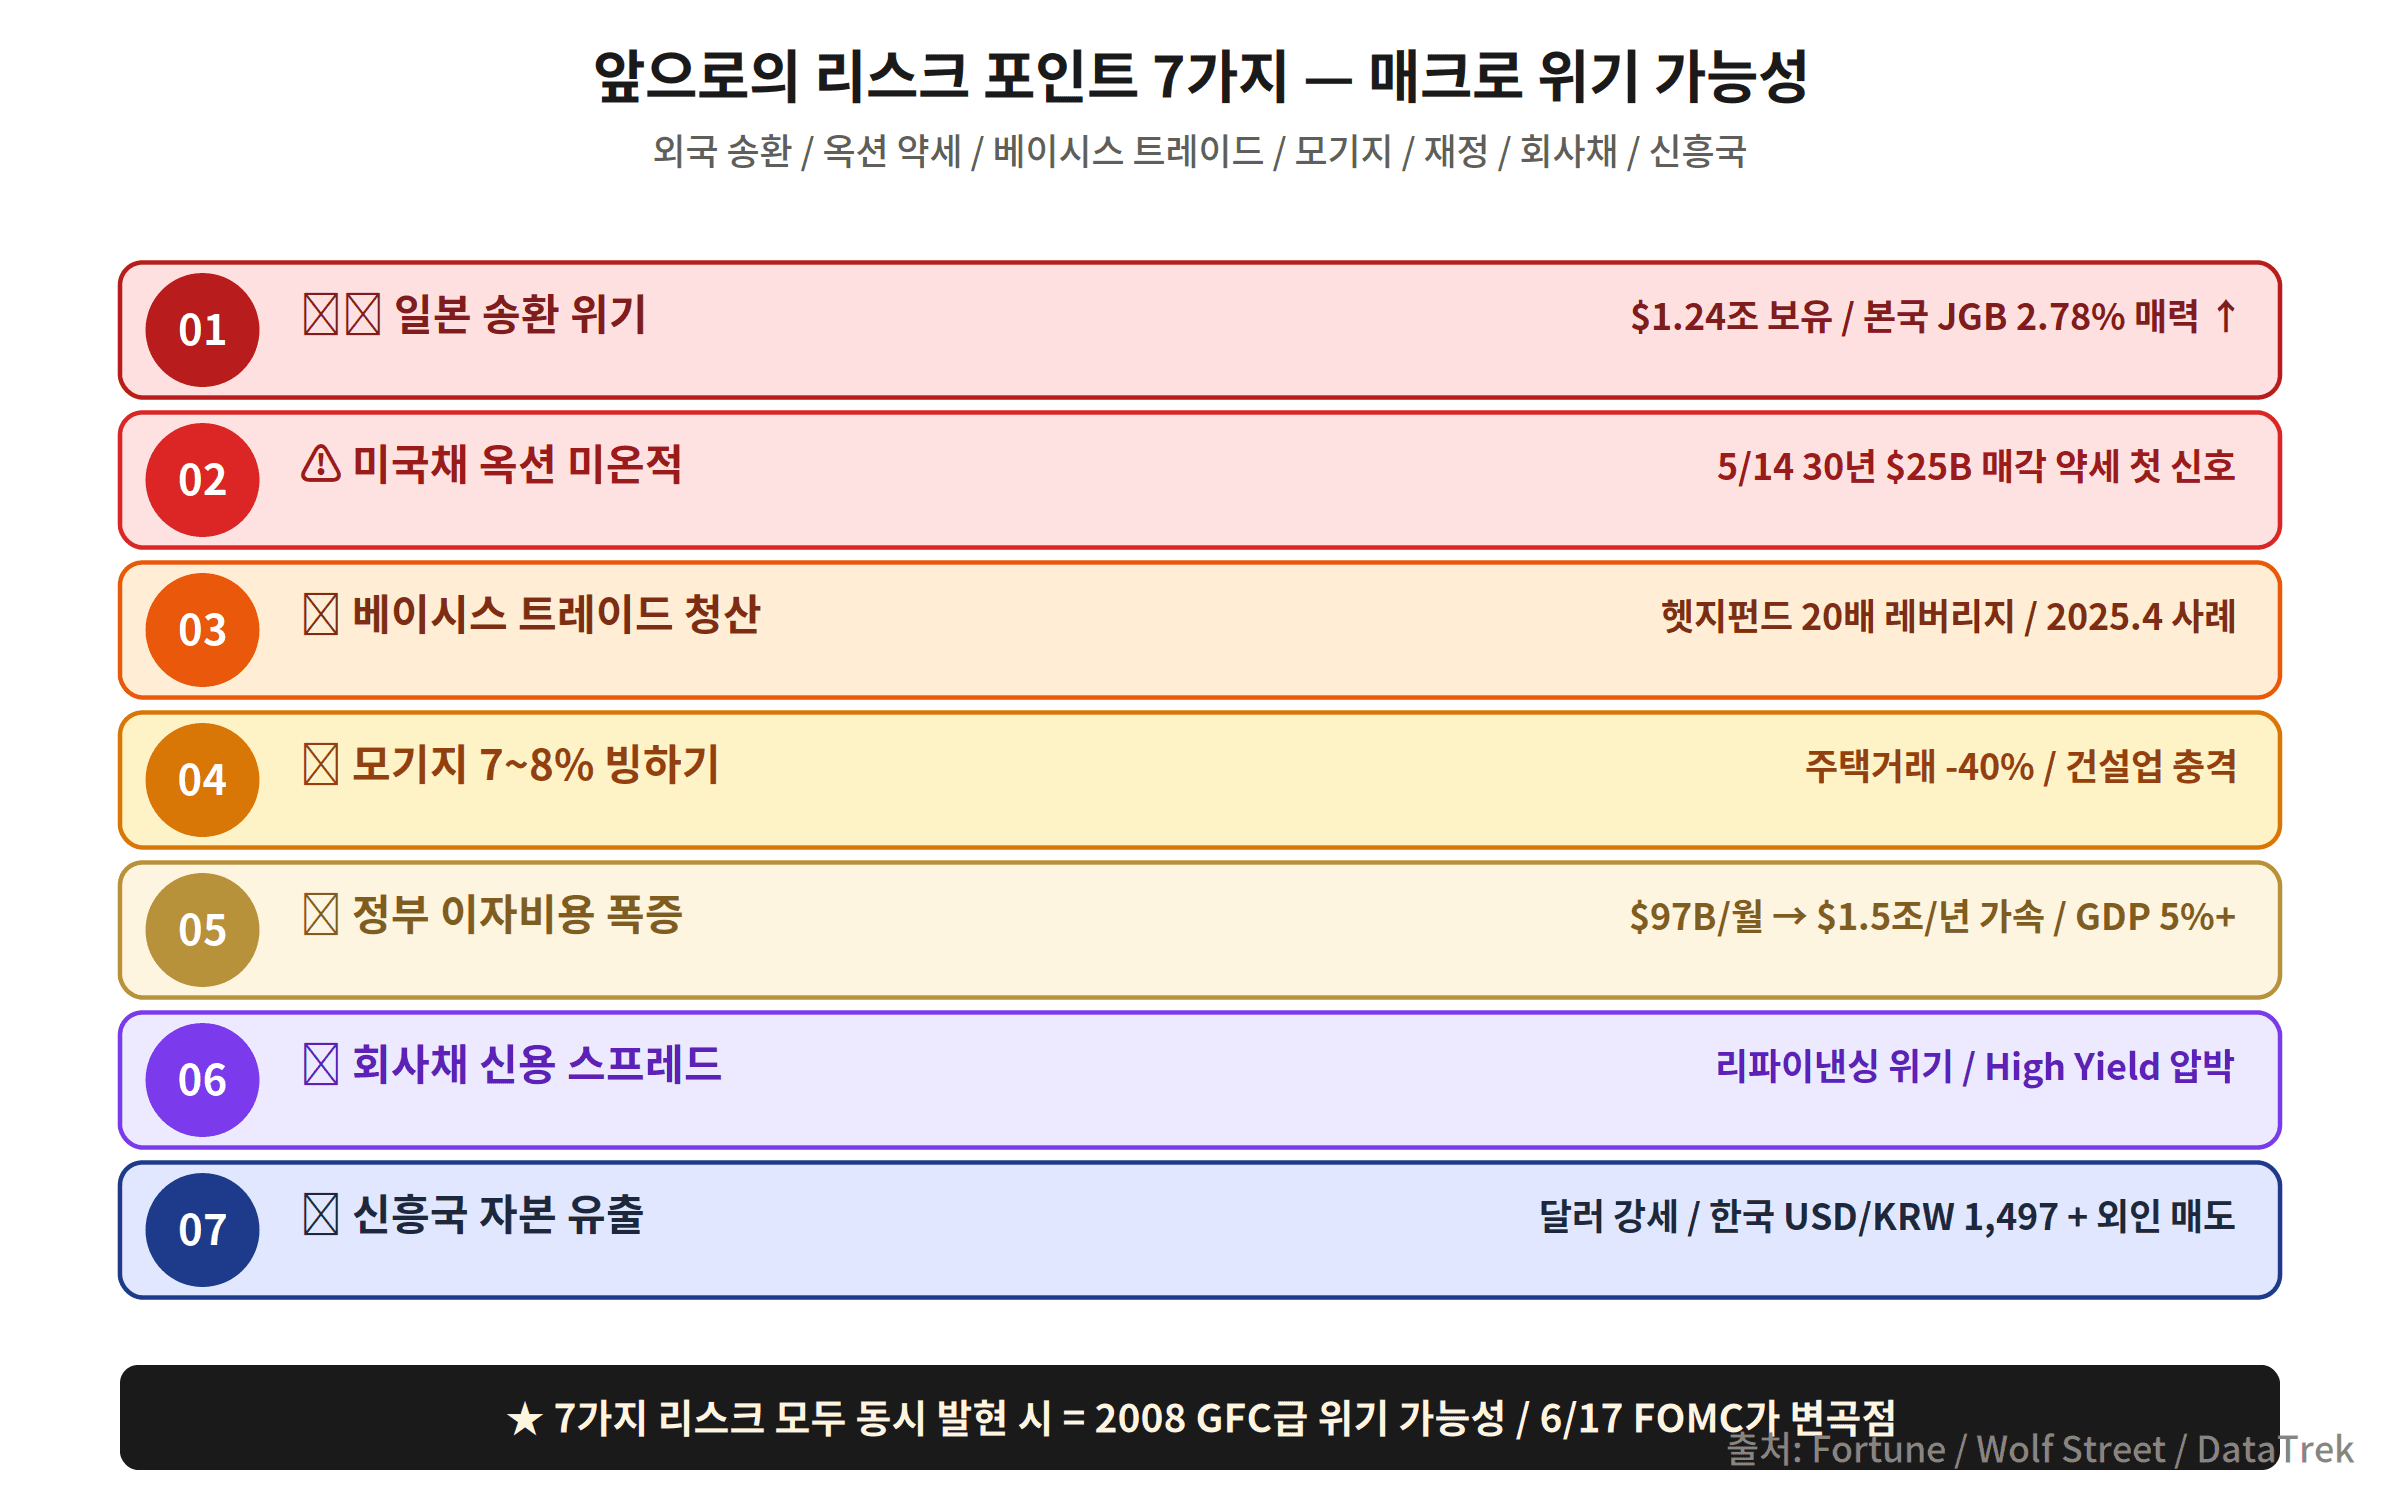
Risk 1 (Highest): Japan repatriation crisis — Japan JGB 10Y at 2.78% (28-year high), making repatriation of $1.24T in US Treasuries increasingly attractive. Risk 2: Mortgage rates enter 7–8% range — 30Y Treasury at 5% = 30Y mortgage at 7–8%. US housing market could freeze. Risk 3: Federal interest costs explode — $97B/month already the 2nd largest expenditure. Tax cut bill could add $5–7T to debt. Risk 4: Warsh policy dilemma — Warsh takes office today, nominated to cut rates but facing 6% inflation. June 17 FOMC is his first test.
Sector Impact + S&P P/E -25% Pressure
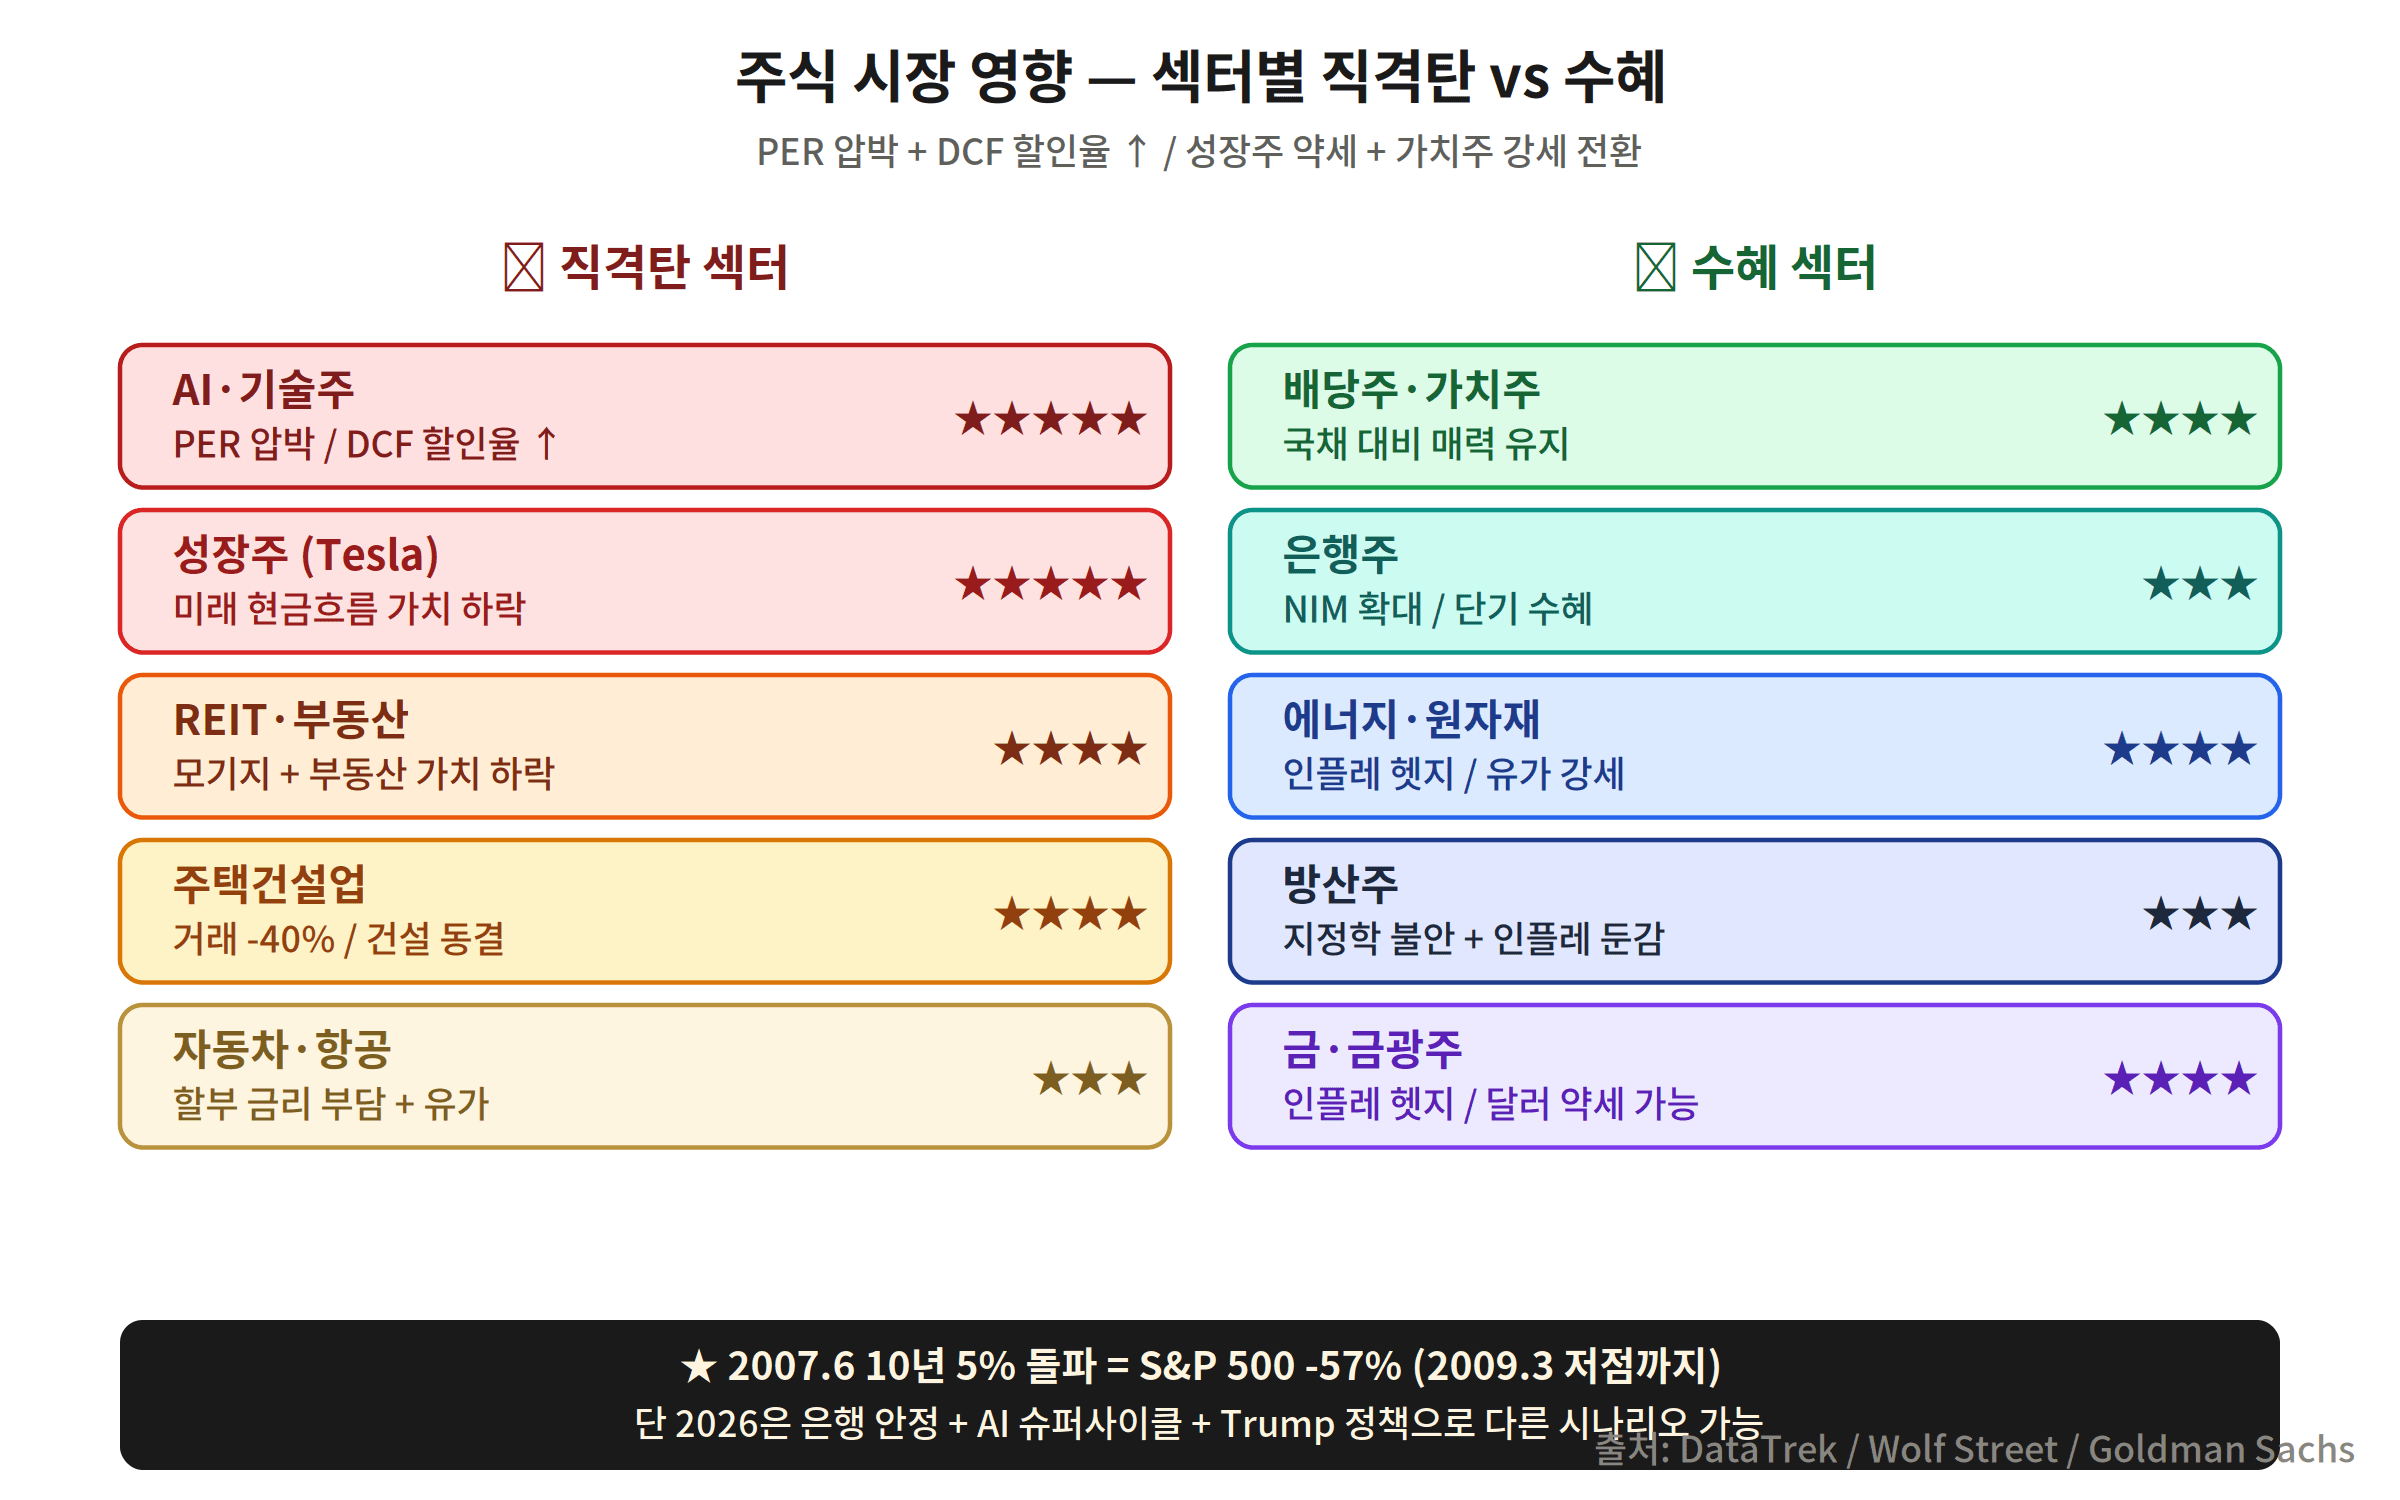
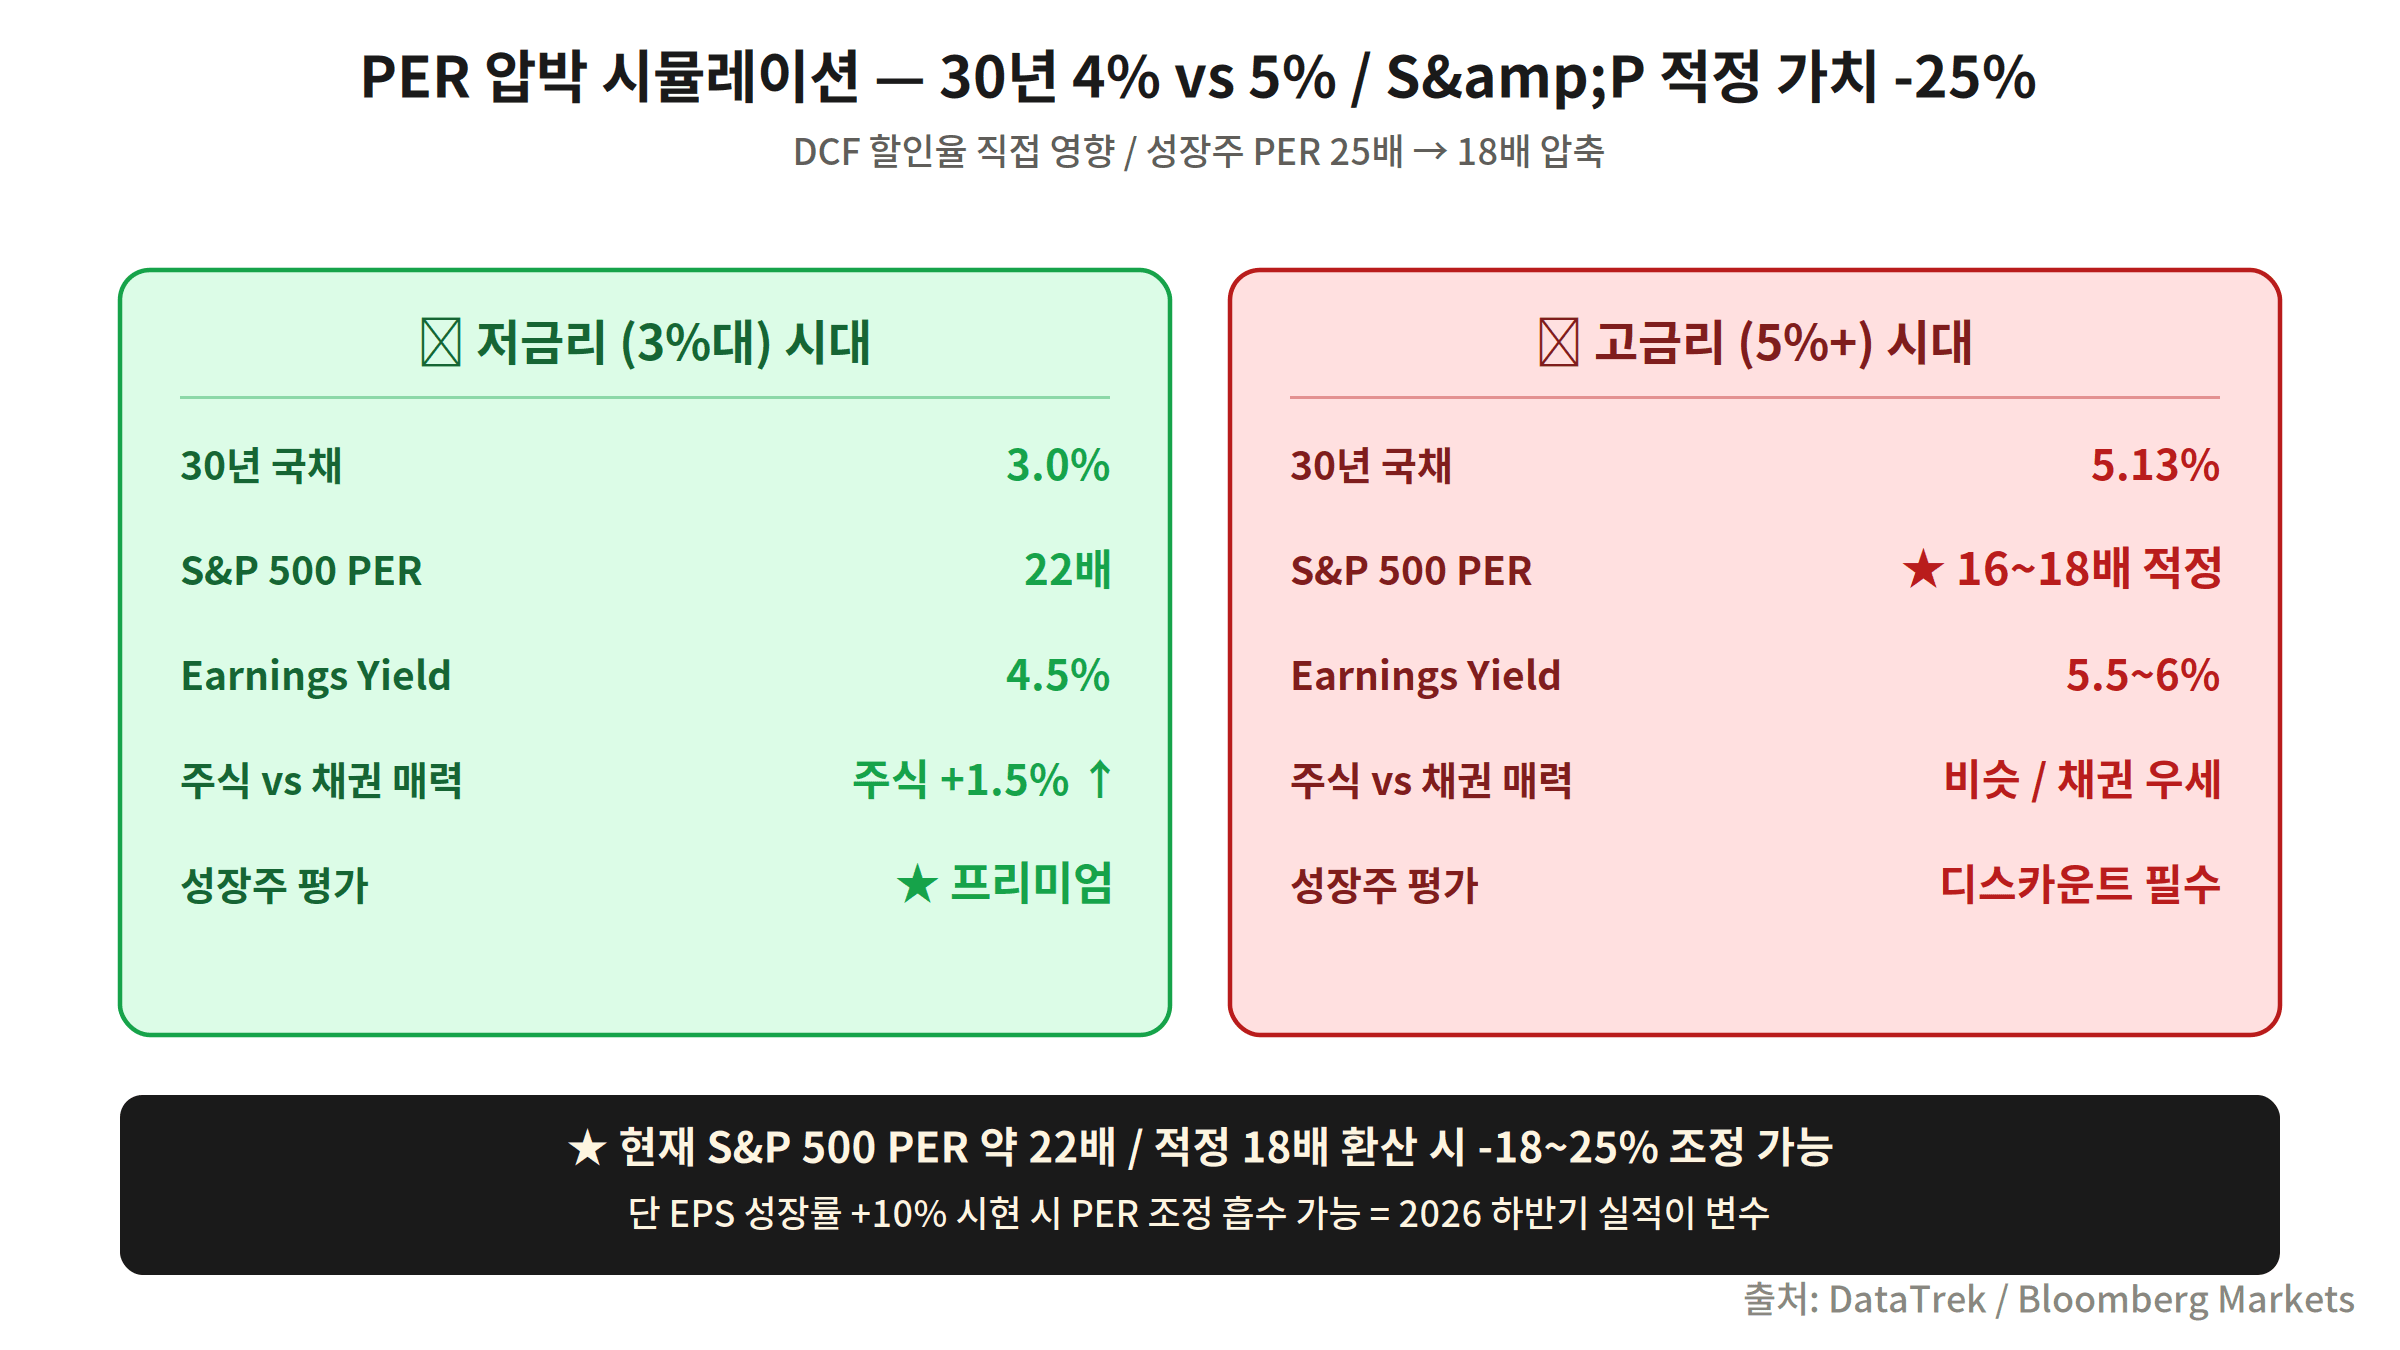
Direct sector hits from rising rates: ① Real estate (REITs) -20–30% — borrowing costs take a direct hit ② Utilities -15–20% — dividend appeal fades ③ High-P/E growth stocks -20–30% — DCF discount rate rises ④ Financials +5–10% — NIM expansion benefits ⑤ Energy -5% — economic slowdown concern. S&P 500 P/E simulation: current 22x → fair value at 16–17x if rates settle at 5% → -25% price correction pressure. Note that 2007’s P/E was 17x — the market is more expensive now.
2007 vs 2026 Comparison Matrix
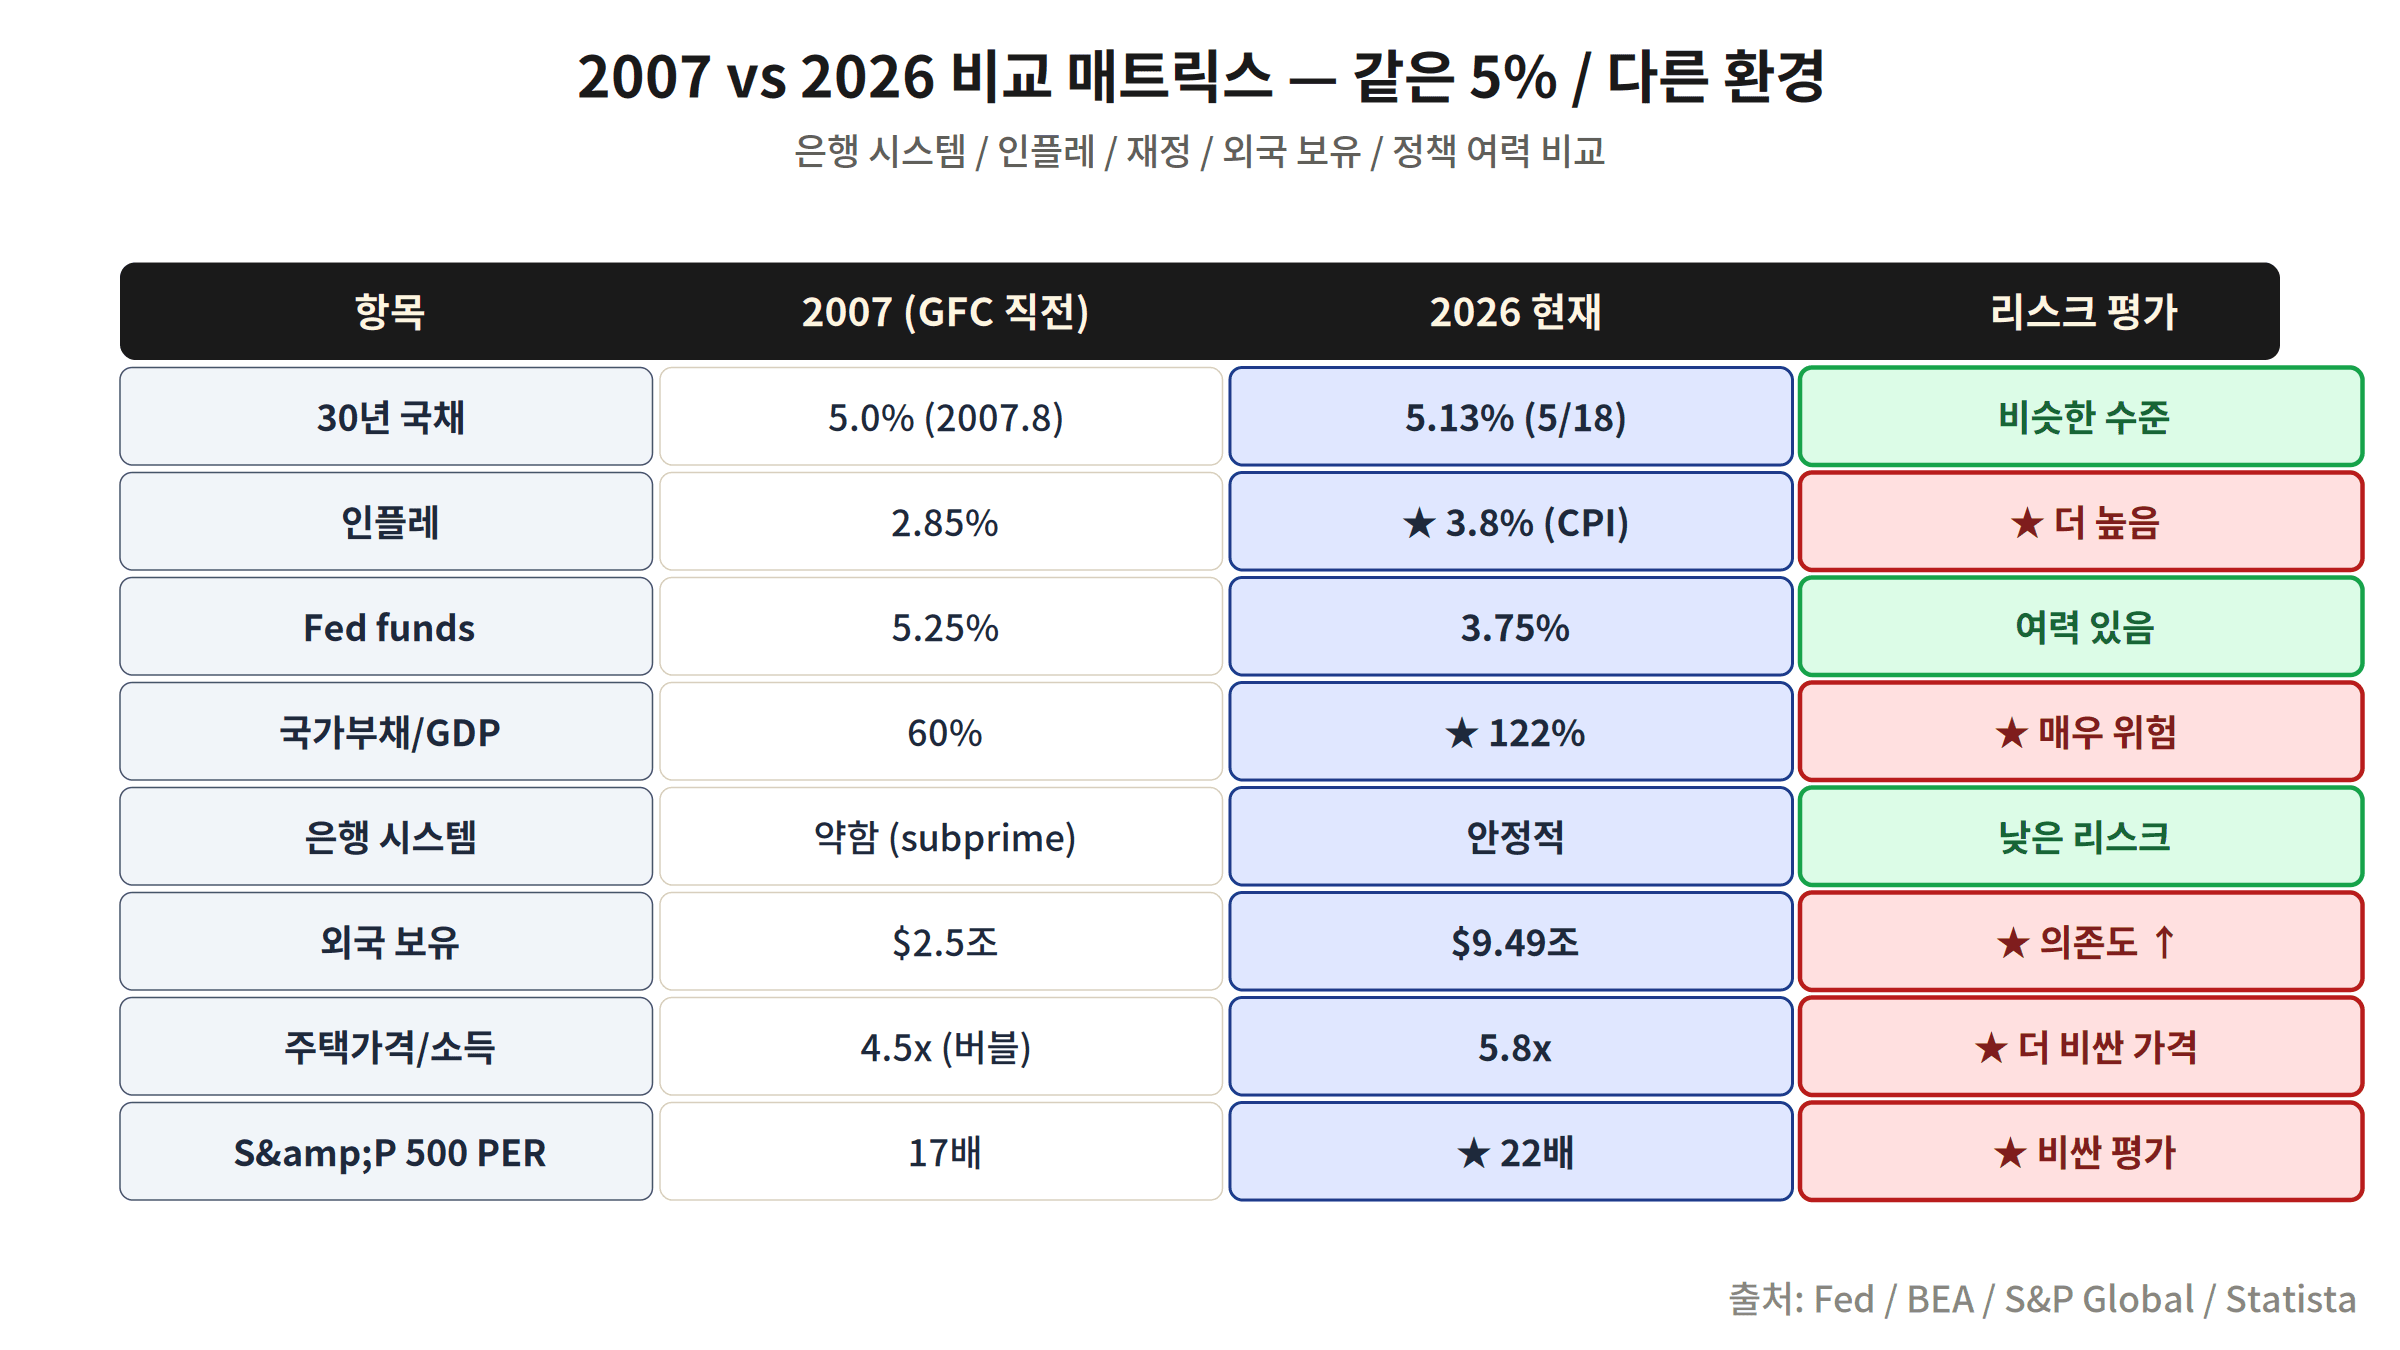
Same as 2007: 30Y in the 5% zone, entrenched inflation, Fed dilemma. Different: Debt/GDP 60% → 122%, foreign holdings $2.5T → $9.49T, S&P P/E 17x → 22x. The banking system is more stable than 2007, but fiscal risk is far greater. The key distinction: in 2007 the catalyst was a financial system collapse; in 2026 it may be a fiscal crisis.
Korean KOSPI Impact + 5 Korean Investor Strategies
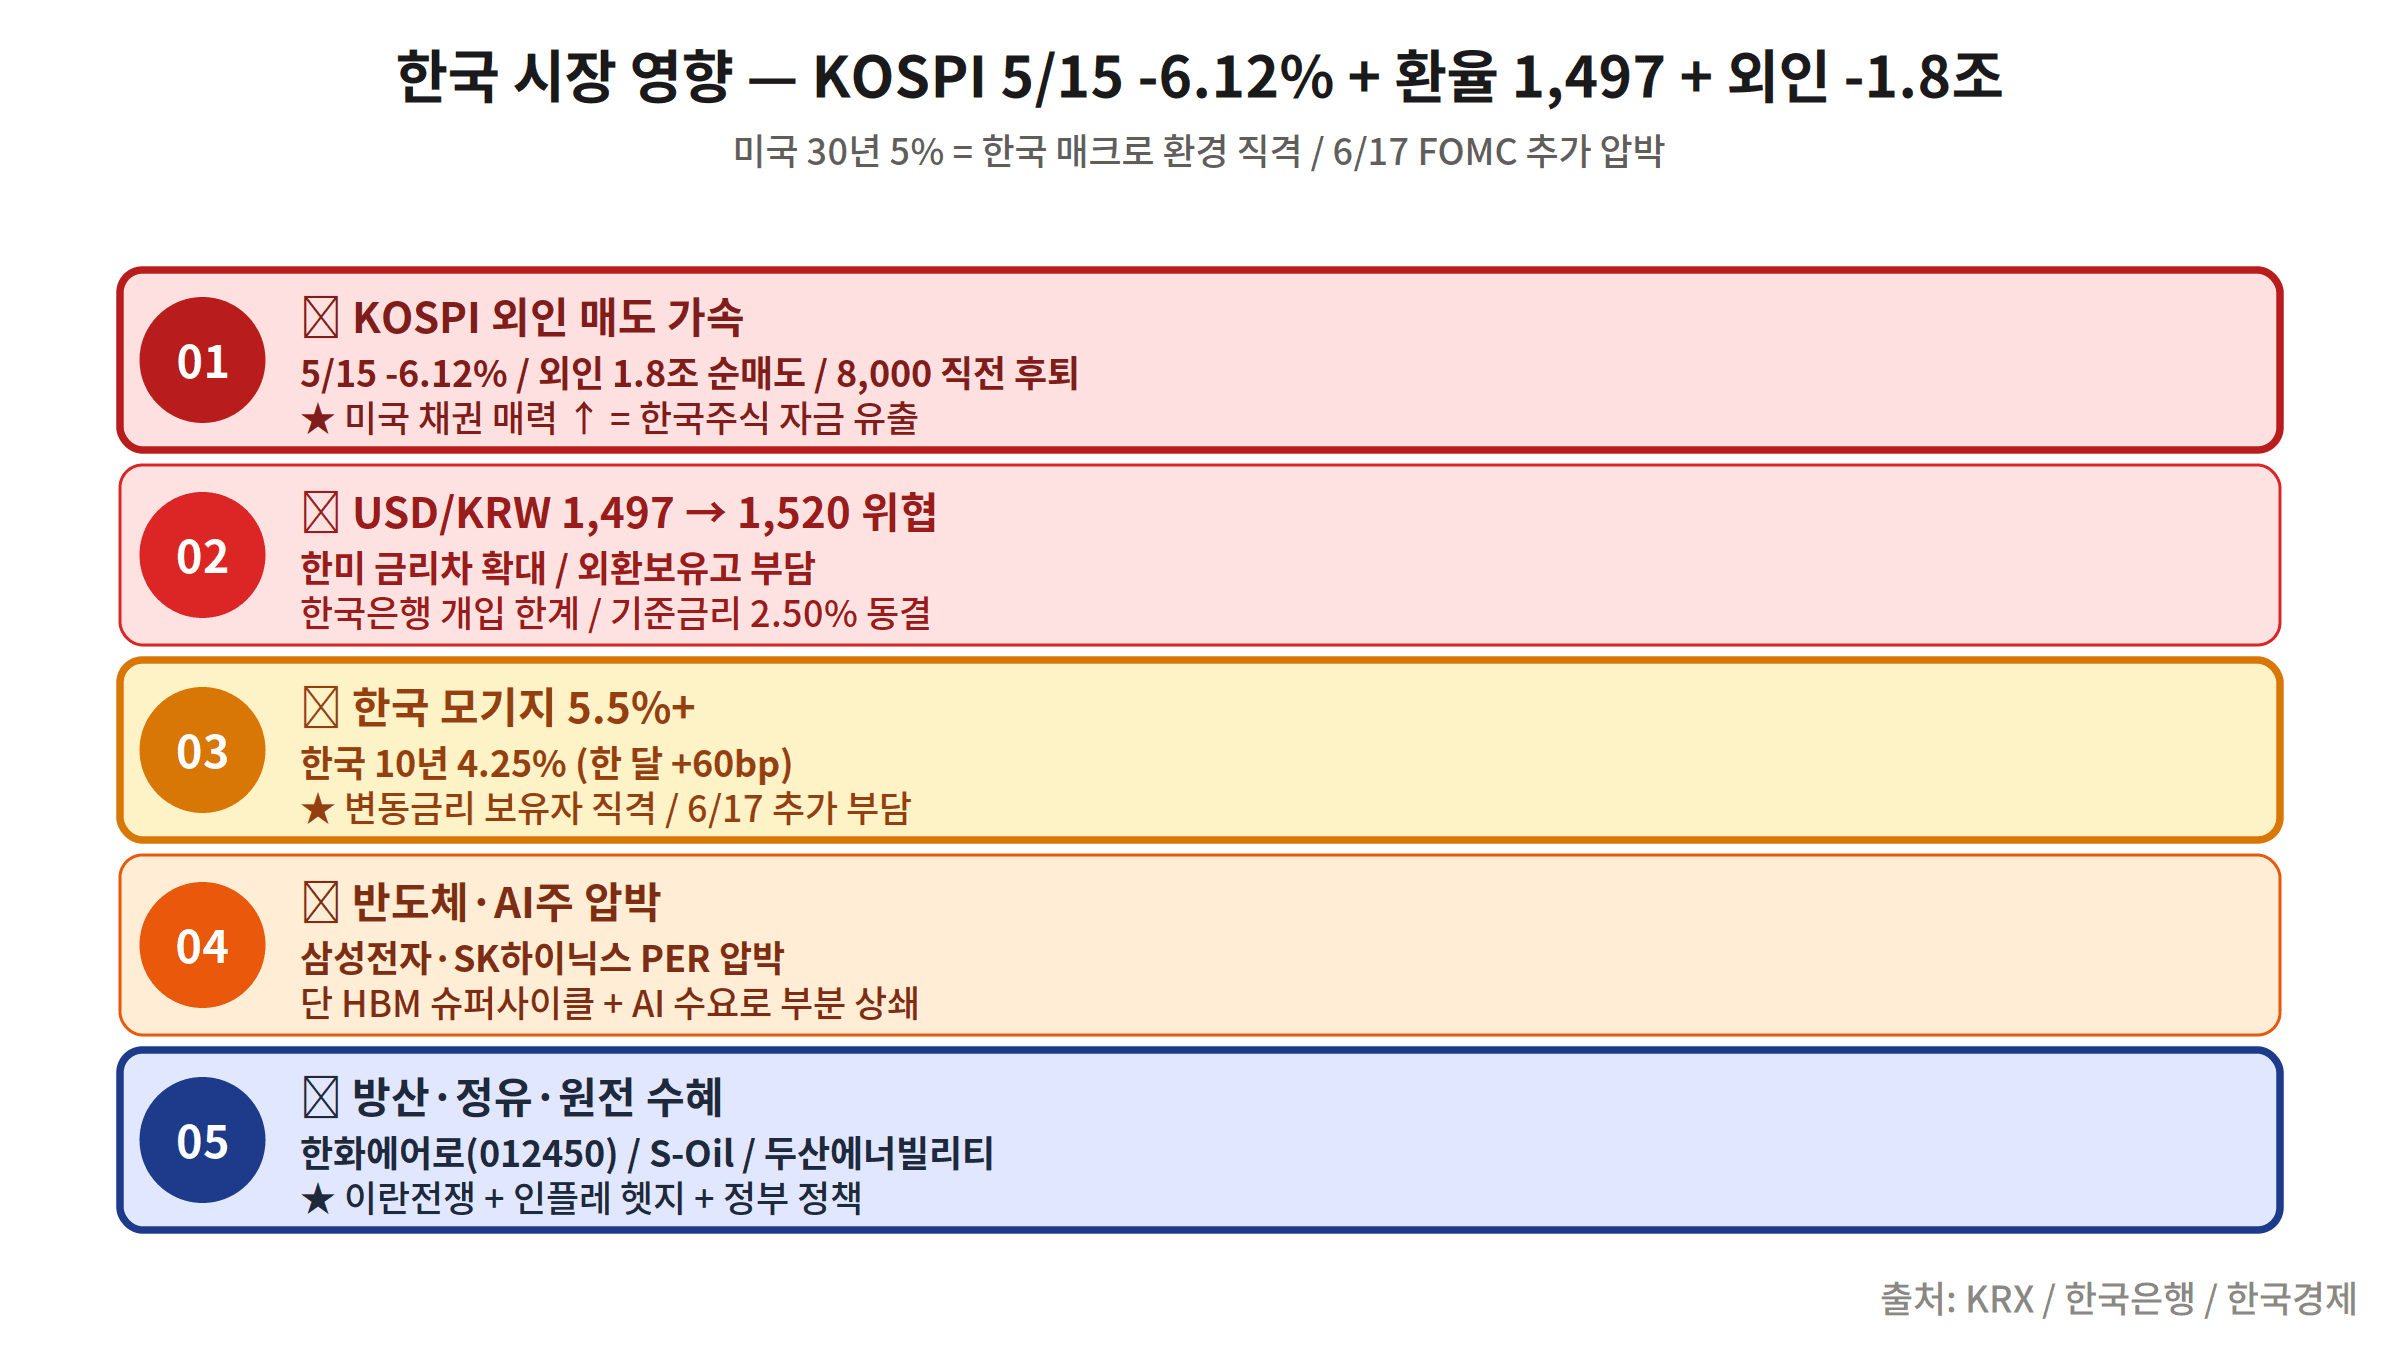
Five impacts on Korea: ① Foreign selling accelerates — US risk-free rate at 5% = EM capital outflow trigger. KOSPI’s -6.12% crash on May 15 was the first signal ② Won weakness — dollar strength pressure (though paradoxically the dollar is currently weak) ③ BOK under pressure — widening Korea-US rate gap → further hike pressure ④ Corporate borrowing costs rise — KEPCO, construction, real estate hit directly ⑤ Exporters near-term neutral — dollar weakness offset effect.
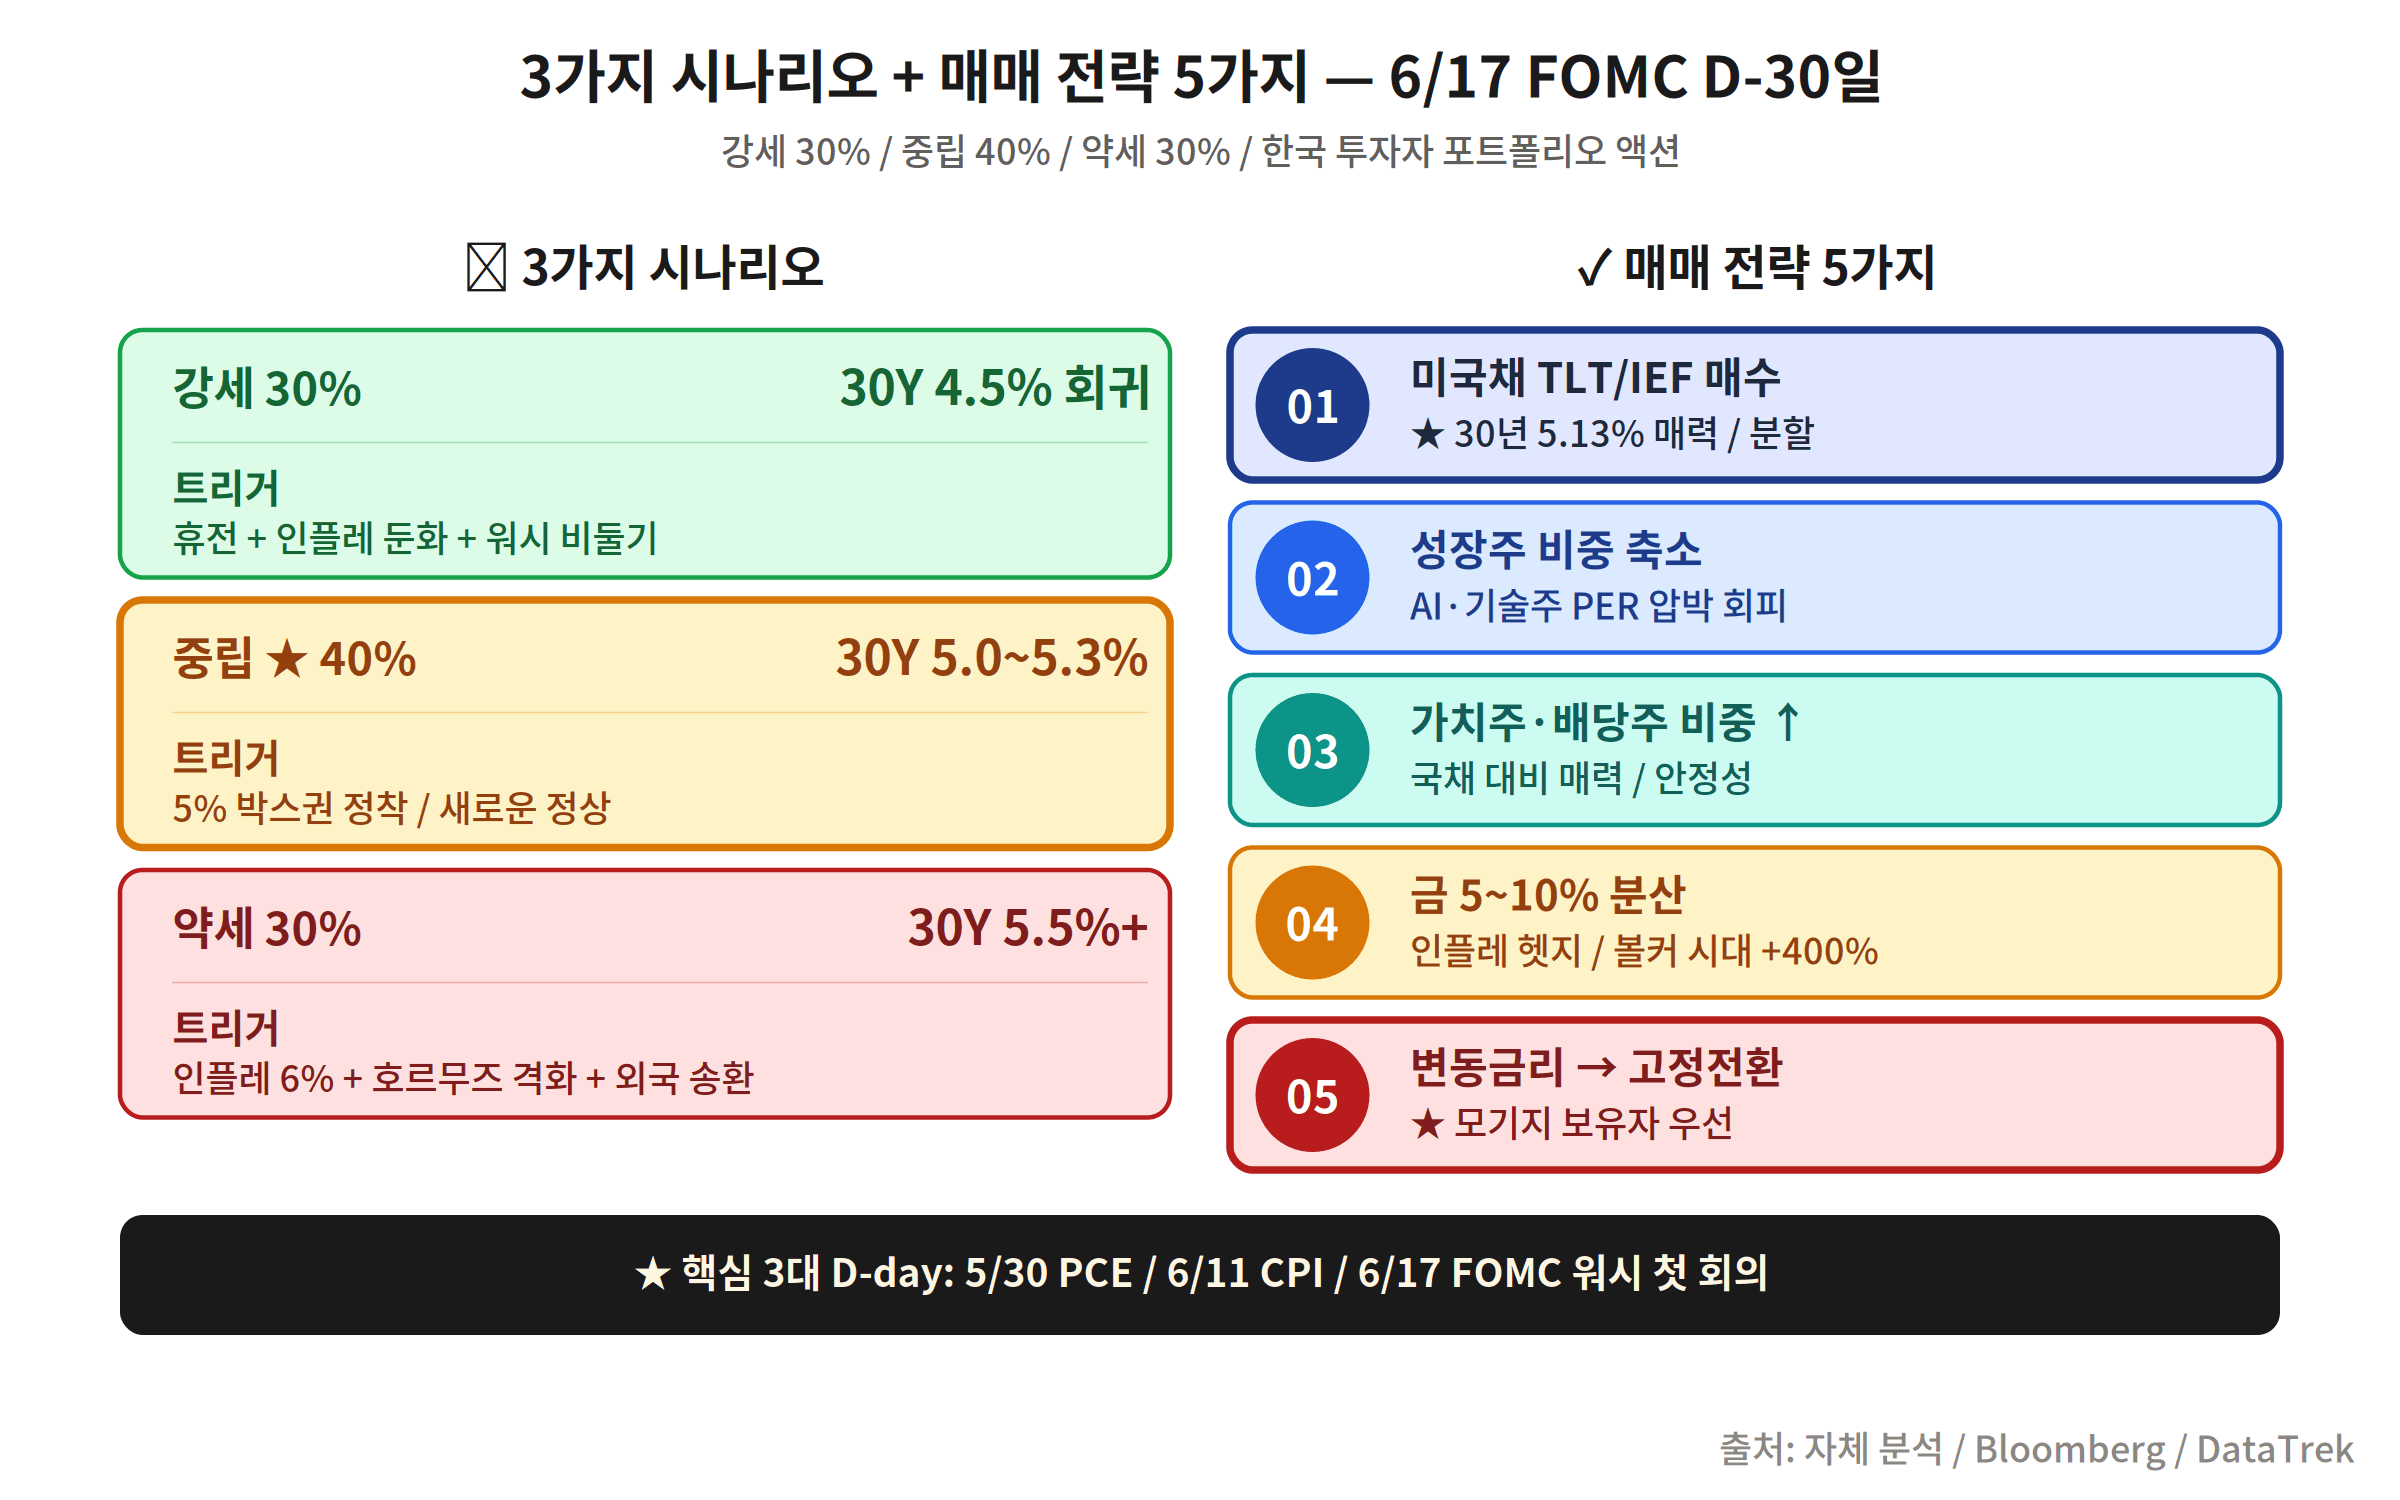
- Increase gold/precious metals ETF allocation (5–10%): 30Y at 5% + 6% inflation → negative real rate environment. Optimal for gold.
- Sell or avoid long-duration TLT: Further rate rises mean further bond price declines. Consider inverse ETF (TBF).
- Korean financials (bank stocks) neutral-to-positive: NIM expansion benefit. But watch short-term volatility from foreign selling pressure.
- Reduce high-P/E growth stock exposure: Rising discount rate → DCF value structurally lower. KOSDAQ AI stocks especially vulnerable.
- Hold 30%+ cash + wait for June 17 FOMC: Warsh’s first meeting outcome determines bond/equity direction. Stand by until then.