
PCE release on May 29 — Fed path, asset reaction matrix, and a 5-step playbook
Trending · US Economy · May 26, 2026
The April PCE release on May 29 will decide the June FOMC hold probability (currently 70%+). Core PCE consensus sits at 2.6~2.8%; here is the full breakdown of scenario-driven asset reactions, Korea market spillovers, and five concrete investment strategies.
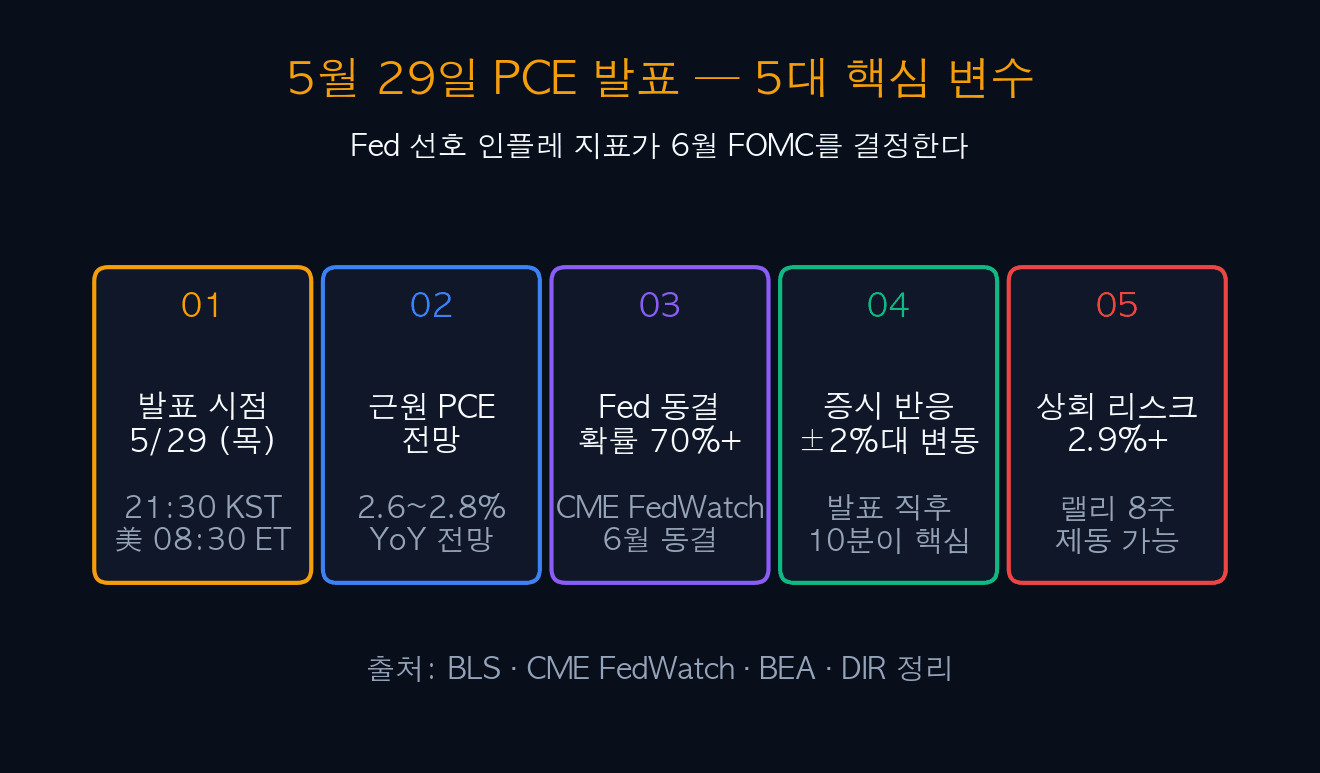
On Thursday, May 29, 2026 at 21:30 KST (08:30 ET), the US Bureau of Economic Analysis (BEA) releases the April PCE price index. PCE is the Federal Reserve’s preferred inflation gauge and the direct input into the June 16~17 FOMC decision. The most critical reading is Core PCE, which strips out volatile food and energy. The full release schedule and methodology are documented on the official BEA page.
Consensus puts Core PCE at 2.6~2.8% YoY. Wherever the print lands, the June hold probability (now 70%+) will reprice instantly, and equities, bonds, the dollar, and gold will all move together. This column unpacks what PCE actually measures, the scenario-by-scenario asset reactions, June FOMC probability shifts, Korea market spillovers, and five investment strategies built around the print.
| Item | Current Status | Key Point |
|---|---|---|
| Release time | 5/29 (Thu) 21:30 KST | 08:30 ET |
| Core PCE consensus | 2.6~2.8% YoY | 0.7pp above Fed’s 2.0% target |
| Fed hold probability | 70%+ | CME FedWatch, June meeting |
| Equity reaction | First 10 min are decisive | Pre-market reprices instantly |
| Upside risk | 2.9%+ ends 8-week rally | Dow 50,580 ATH at risk |
01. What PCE Is — and How It Differs from CPI
PCE (Personal Consumption Expenditures Price Index) is an inflation gauge published monthly by the BEA. It is the single index the Fed officially uses for policy decisions, ranking above CPI in importance.
Both PCE and CPI measure inflation, but they are constructed differently. PCE captures all spending by households plus nonprofits, gives a low weight to shelter (~15%), and includes medical spending paid via insurance and government. CPI tracks only direct urban consumer spending and weights shelter heavily at ~33%.
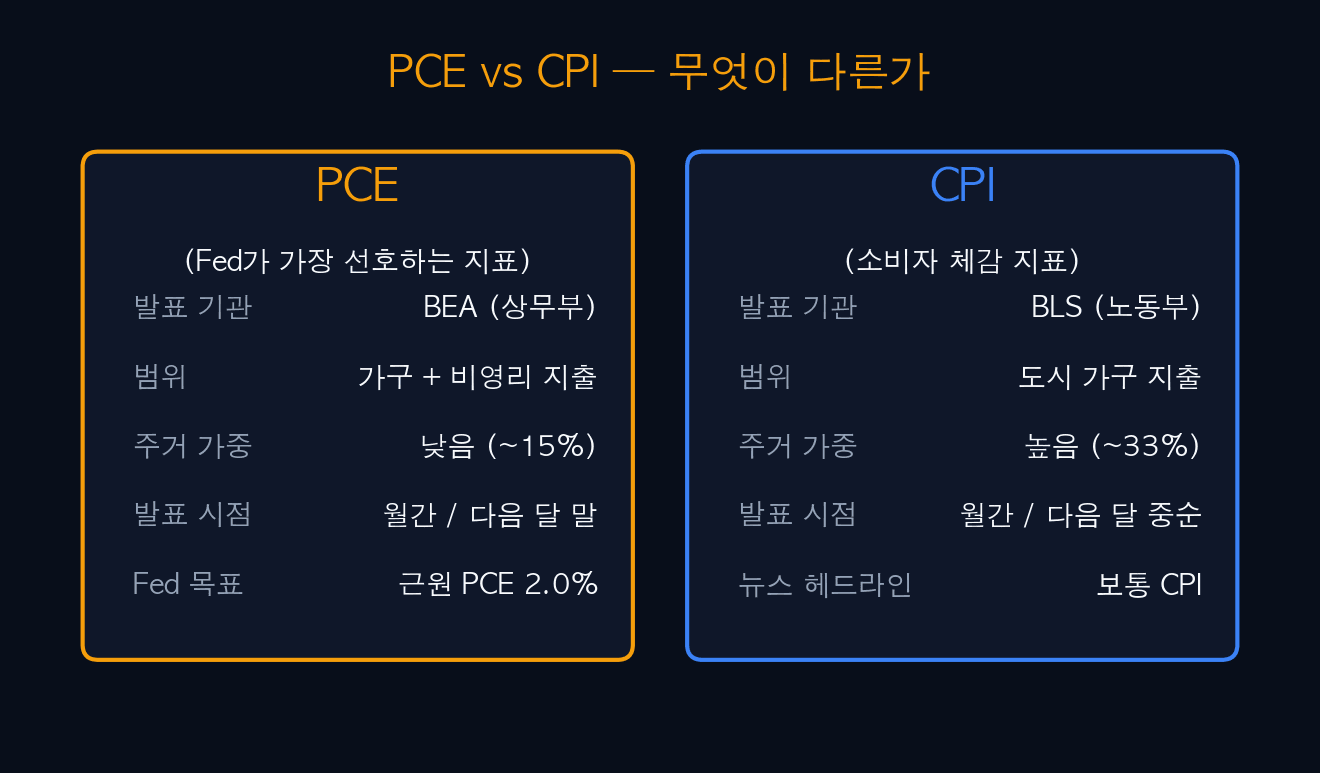
| Item | PCE (Fed preferred) | CPI (headline) |
|---|---|---|
| Publisher | BEA (Commerce) | BLS (Labor) |
| Scope | Households + nonprofits | Urban households only |
| Shelter weight | Low (~15%) | High (~33%) |
| Release timing | Monthly / late next month | Monthly / mid next month |
| Fed target | Core PCE 2.0% | Reference only |
| Latest reading | Core 2.7% (March) | Core 3.1% (April) |
(1) Substitution effect — PCE captures consumers shifting from expensive items to cheaper ones. (2) Broader scope — it includes medical insurance and government spending, providing a fuller picture of economy-wide inflation. (3) Lower volatility — the smaller shelter weight makes it more stable than CPI. These three reasons drove the Fed to adopt PCE as its official target back in 2000.
02. Recent Core PCE Trend — 0.7pp Above the Fed’s 2.0% Target
Core PCE has been range-bound between 2.6~2.8% since Q4 2025. About 0.7 percentage points still separate it from the Fed’s 2.0% goal, and until that gap narrows, a full easing cycle cannot really begin.
The last six months show a brief dip to 2.6% in Nov-Dec followed by a rebound to 2.7~2.8% in Jan-Feb. Oil prices driven by the Iran conflict are pushing headline PCE higher, but Core PCE excludes food and energy and has held steadier.
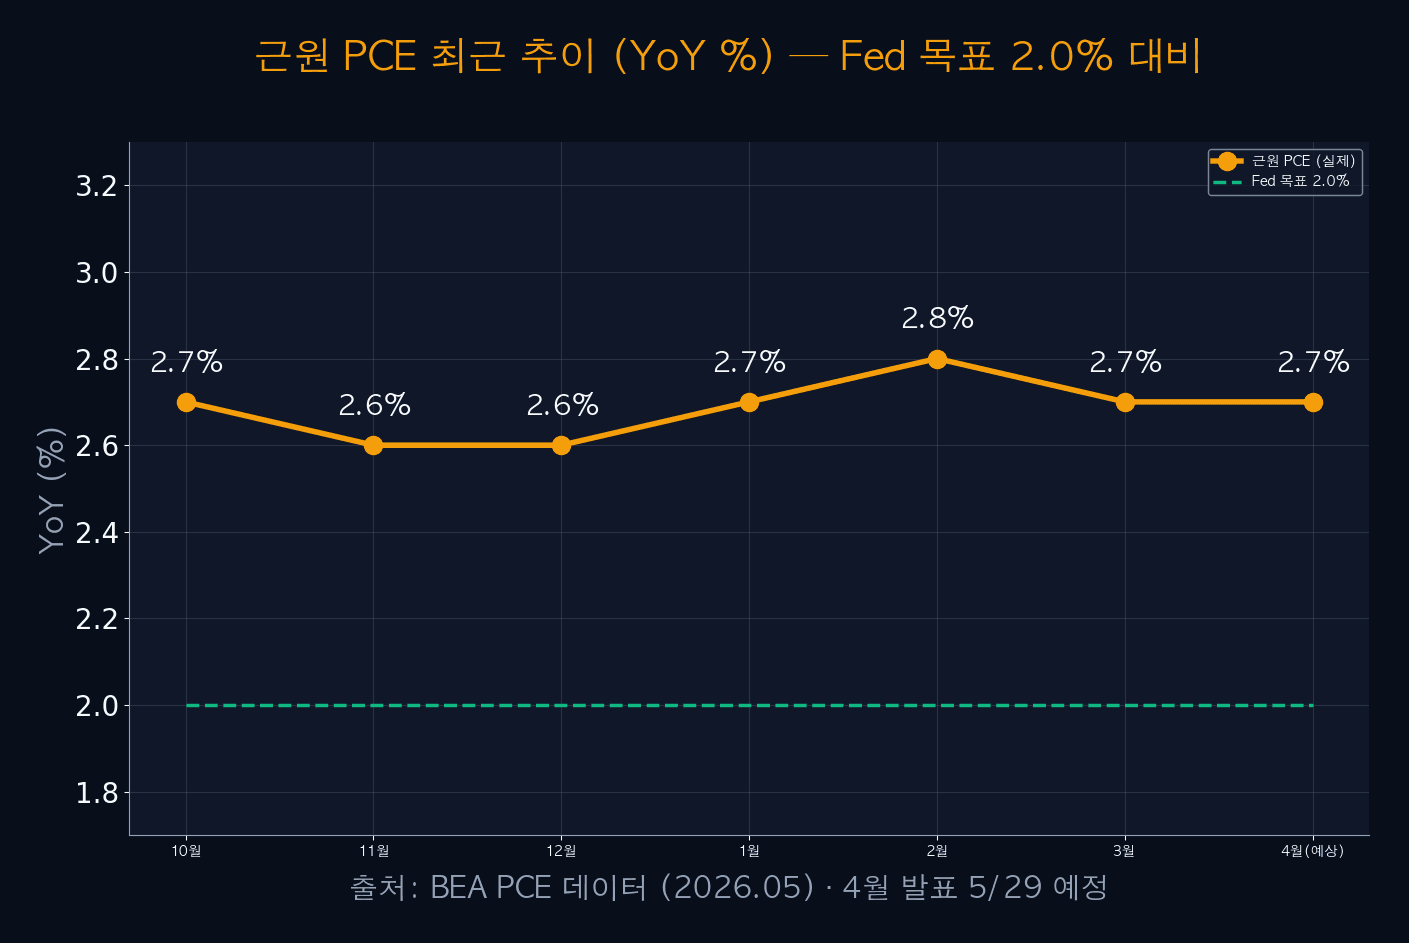
| Month | Core PCE | Headline PCE | Note |
|---|---|---|---|
| Oct | 2.7% | 2.4% | Services inflation persists |
| Nov | 2.6% | 2.3% | Brief slowdown |
| Dec | 2.6% | 2.4% | Range-bound |
| Jan | 2.7% | 2.5% | Services prices firm up again |
| Feb | 2.8% | 2.7% | Iran conflict impact begins |
| Mar | 2.7% | 2.9% | Oil pushes headline higher |
| Apr (forecast) | 2.6~2.8% | 3.0%+ | Released 5/29 |
Headline PCE has already crossed into the 3% range thanks to oil. But the Fed’s preferred Core PCE is likely to stay in 2.6~2.8%. If the gap (headline minus core) widens to 0.4pp or more, the Fed will read it as a temporary oil shock and refrain from policy changes.
03. PCE Scenarios and Market Impact — Below, In Line, Above
April PCE breaks into three scenarios. Below consensus (25%), in line (50%), and above consensus (25%). Each scenario produces a distinctly different asset reaction.
A downside print (below 2.5%) revives July cut bets and pushes the S&P 500 up 1.5~2.0% as the rally extends. An in-line print (2.6~2.8%) leaves policy unchanged and keeps markets in range. An upside print (2.9%+) puts hike-discussion pressure back on the Fed and could drag the Dow down 2.0~3.0%.
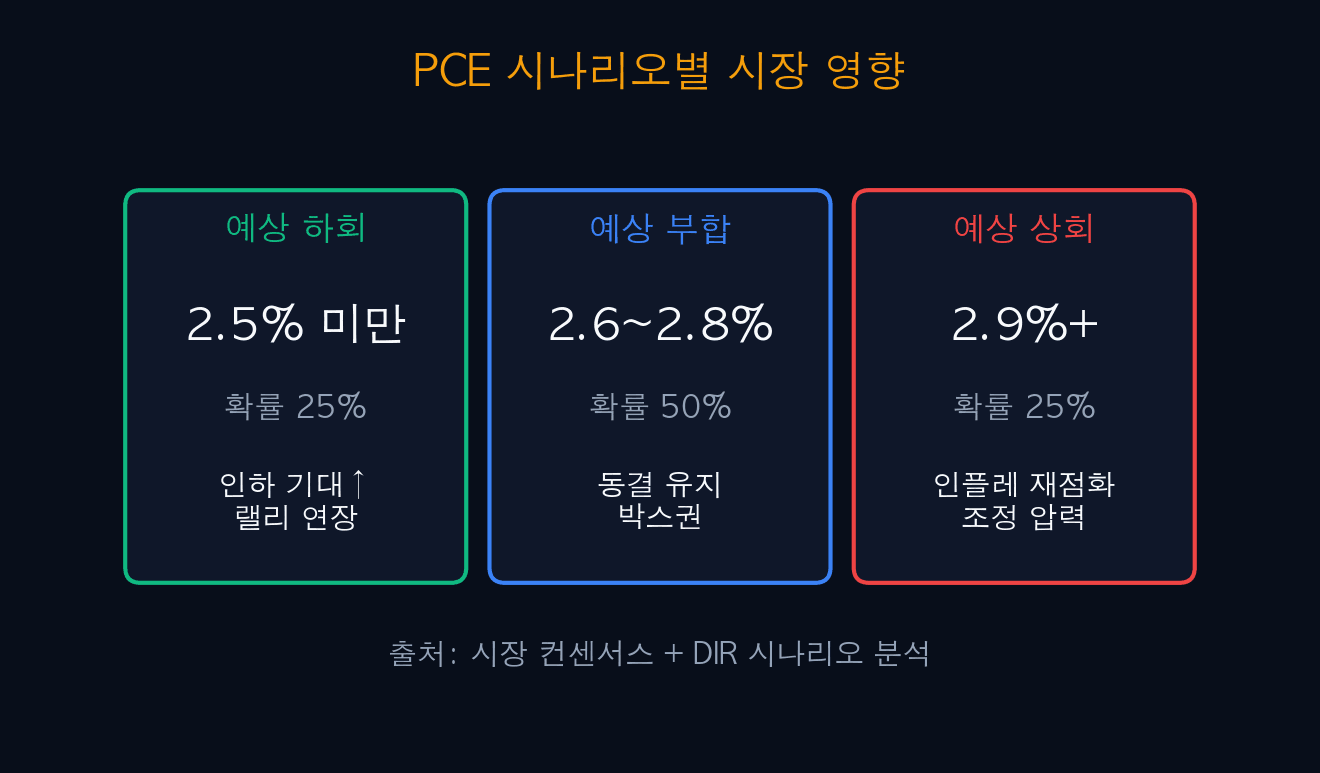
| Scenario | Core PCE | Probability | Fed implication | Equity reaction |
|---|---|---|---|---|
| Below consensus | Below 2.5% | 25% | July cut bets revive | Rally extends +1.5~2.0% |
| In line | 2.6~2.8% | 50% | Policy unchanged | Range ±0.5% |
| Above consensus | 2.9%+ | 25% | Hike-discussion pressure | Pullback -2.0~-3.0% |
If headline PCE prints above 3.0% but Core PCE lands in line at 2.6~2.8%, the initial market reaction will look like panic — but the Fed is likely to label it a transitory oil shock. Markets often calm down within an hour or two in that pattern.
04. The PCE → Fed → Equities Mechanism
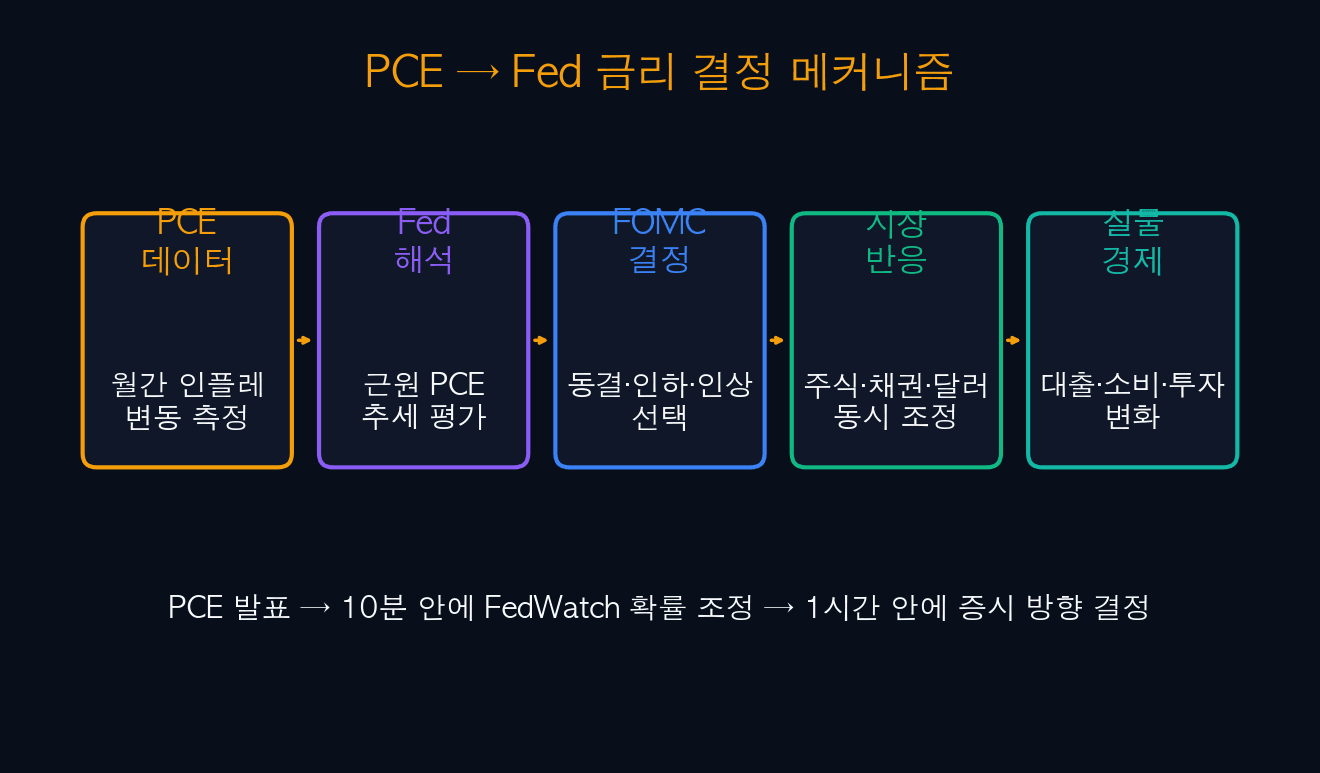
Post-release market action runs through a five-stage mechanism: PCE data release → Fed interpretation → FOMC decision → market reaction → real economy. On the clock, FedWatch probabilities reprice within 10 minutes and the equity direction is usually decided inside the first hour.
The opening 10 minutes are the most important window. Algorithmic trading repositions automatically and most of the move is done before retail can react. The smarter trade is not to bet on the print itself but to enter at the stabilized prices 30~60 minutes after release.
| Stage | Time | What happens | Investor action |
|---|---|---|---|
| 1. PCE release | T+0 | BEA publishes data | Check news immediately |
| 2. Fed interpretation | T+10 min | FedWatch reprices | Peak volatility |
| 3. Market reaction | T+30 min | Stocks, bonds, USD reprice together | Avoid entries (still volatile) |
| 4. Price stabilization | T+1 hour | High-volatility window ends | Begin scaled entries |
| 5. Real-economy impact | T+1 week onward | Lending and consumption shift | Review long-term positions |
05. June FOMC Hold vs Cut Probability Scenarios
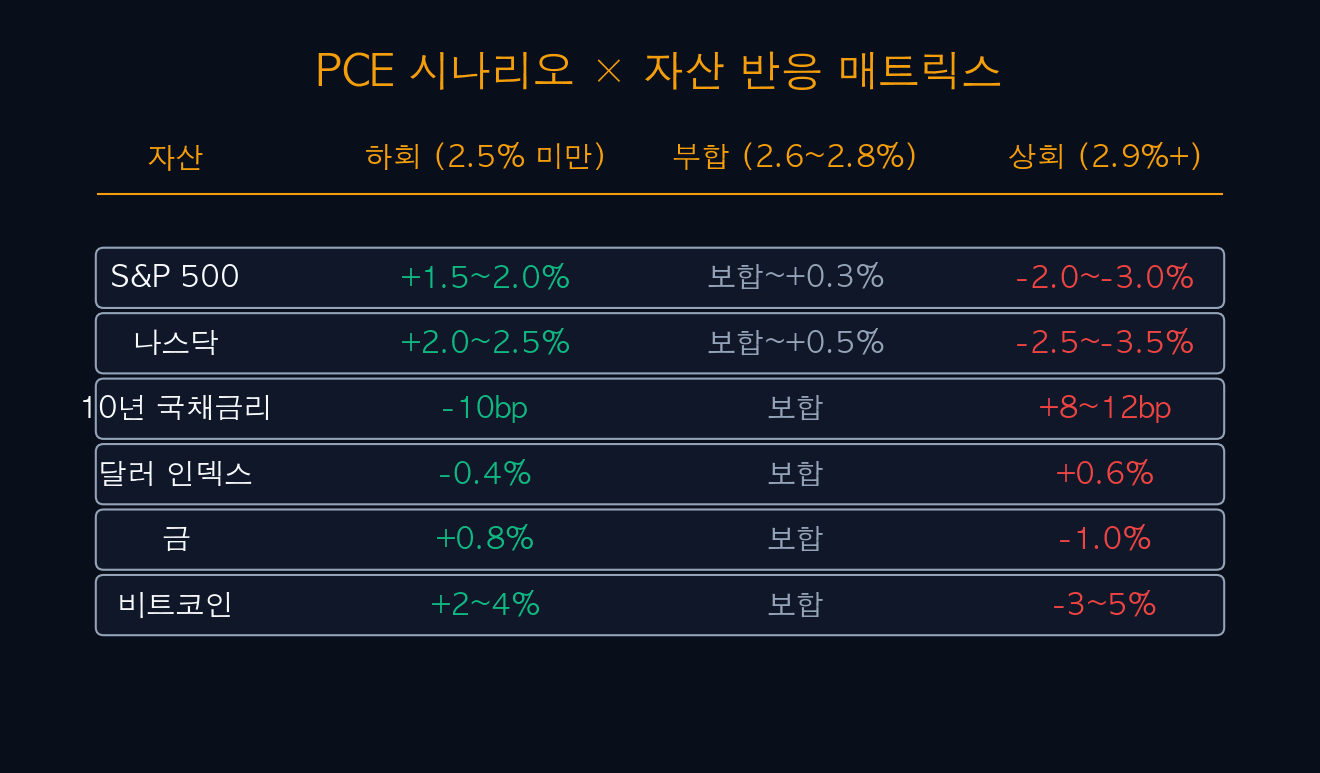
Current CME FedWatch implies a roughly 70% June hold, 28% cut, and 2% hike probability. The PCE result will reprice this distribution immediately.
A downside PCE pushes the cut probability toward 50%, making cut and hold nearly even. An in-line print leaves the current distribution roughly intact. An upside print lifts the hold probability to 90% and begins pricing some hike risk back into the curve.
| Scenario | Hold | Cut | Hike | Market implication |
|---|---|---|---|---|
| Current | 70% | 28% | 2% | Range-bound |
| PCE below | 45% | 50% | 5% | Cut bets reactivate |
| PCE in line | 72% | 26% | 2% | Distribution unchanged |
| PCE above | 90% | 8% | 2% | Hike risk back on the table |
The meeting runs June 16~17 (local time) and is new Chair Warsh’s first scheduled meeting. For the 17 days after PCE, markets will continuously price this meeting. FedWatch probabilities update daily — check every session between 5/30 and 6/16.
06. PCE Scenario × Asset Response Matrix
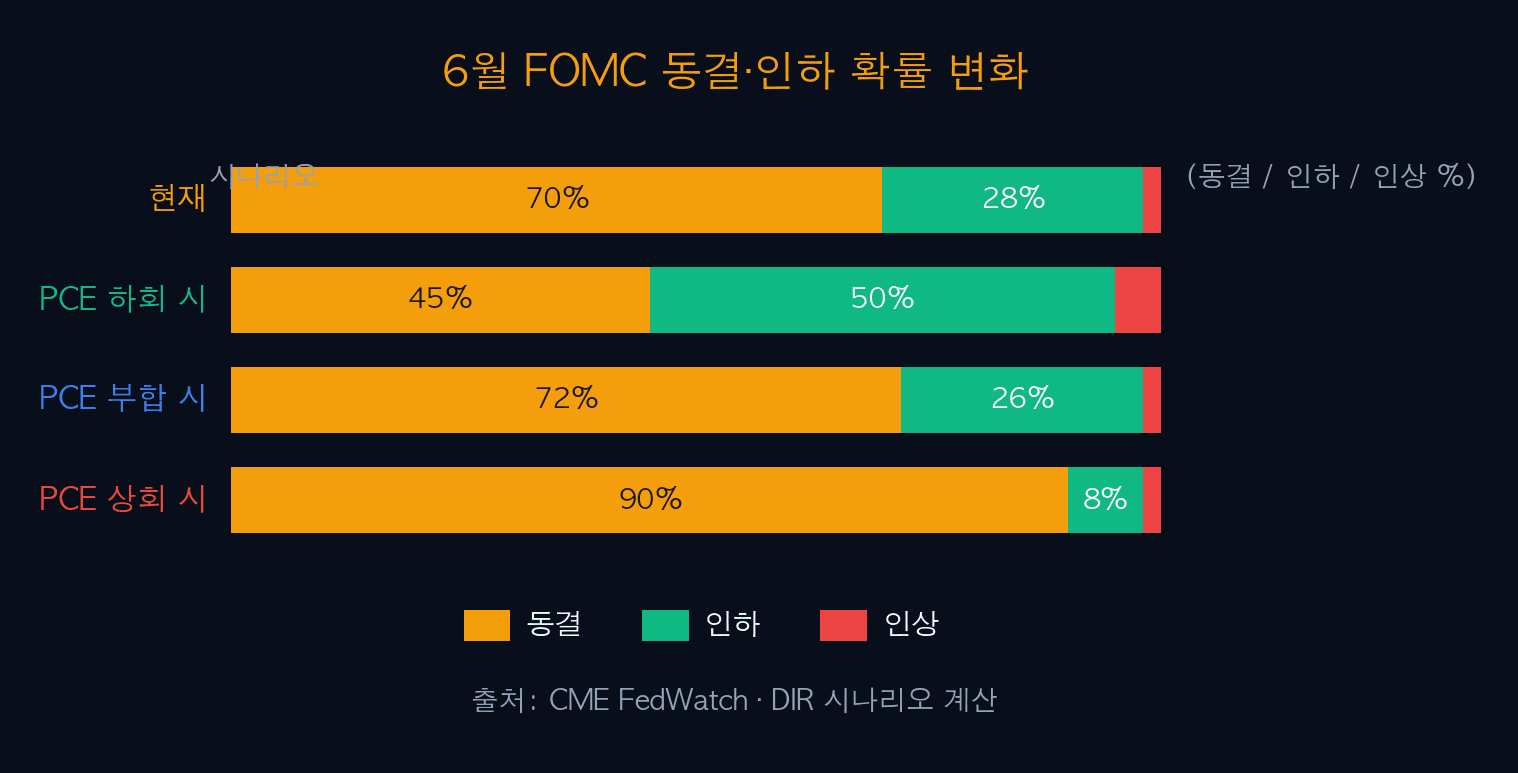
The PCE result does more than move equities. Bonds, the dollar, gold, and Bitcoin all react together. Here are the expected ranges by asset for each scenario.
In the downside scenario all risk assets rally and the dollar weakens. In the upside scenario it is the mirror image — risk assets sell off, the dollar strengthens, bonds weaken (yields rise). Bitcoin is the highest-beta asset of the group, with ±3~5% moves possible.
| Asset | Below (under 2.5%) | In line (2.6~2.8%) | Above (2.9%+) |
|---|---|---|---|
| S&P 500 | +1.5~2.0% | Flat to +0.3% | -2.0~-3.0% |
| Nasdaq | +2.0~2.5% | Flat to +0.5% | -2.5~-3.5% |
| 10Y Treasury yield | -10 bp | Flat | +8~12 bp |
| Dollar index | -0.4% | Flat | +0.6% |
| Gold | +0.8% | Flat | -1.0% |
| Bitcoin | +2~4% | Flat | -3~5% |
Nasdaq and Bitcoin respond most aggressively to PCE. Growth stocks sit directly on the rate path, and Bitcoin reprices risk appetite in real time. Defensive investors should review their weighting in these two before the release.
07. Korea Market Impact — KOSPI, FX, Bonds
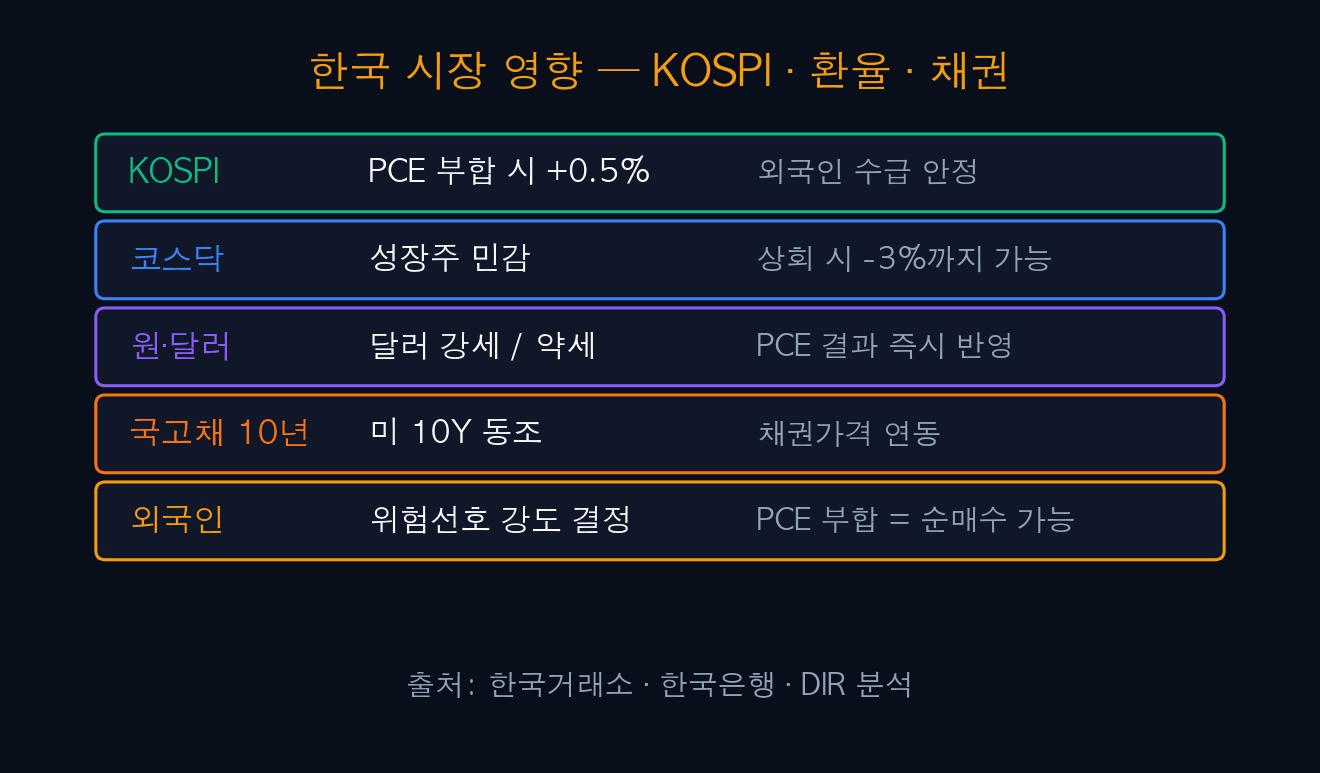
The PCE result lands in Korea instantly. With the release at 21:30 KST, the move is reflected in the KOSPI open the next morning. Foreign flows and the USD/KRW rate find their direction within an hour.
An in-line print lifts KOSPI roughly 0.5% with potential foreign net buying. A downside print can produce a 1.5%+ rebound, while an upside print risks pushing KOSDAQ growth names down as much as 3%. USD/KRW can move 50~80 won on the print itself.
| Item | Current | Below | In line | Above |
|---|---|---|---|---|
| KOSPI | ~7,270 | +1.5%~ | +0.5% | -1.5% |
| KOSDAQ | ~1,163 | +2.0%~ | +0.7% | -3.0% |
| USD/KRW | ~1,500 | ~1,460 | ~1,500 | ~1,540 |
| 10Y KTB | ~3.5% | -8 bp | Flat | +8 bp |
| Foreign flow | Net sell 8d | Flip to net buy | Neutral | Net sell continues |
If PCE prints hot, Korea is likely to gap down at the open. Foreign selling tends to concentrate in KOSDAQ growth names. Set a -3% stop-loss off the May 28 close in advance for safety.
08. Trading the PCE Release — 5 Investment Strategies
The right way to trade PCE follows three rules: diversify before the release, wait 30 minutes for stabilization, then scale in. Rather than betting on a single scenario, anchor the portfolio to the in-line case (50%) and hedge the downside and upside tails.
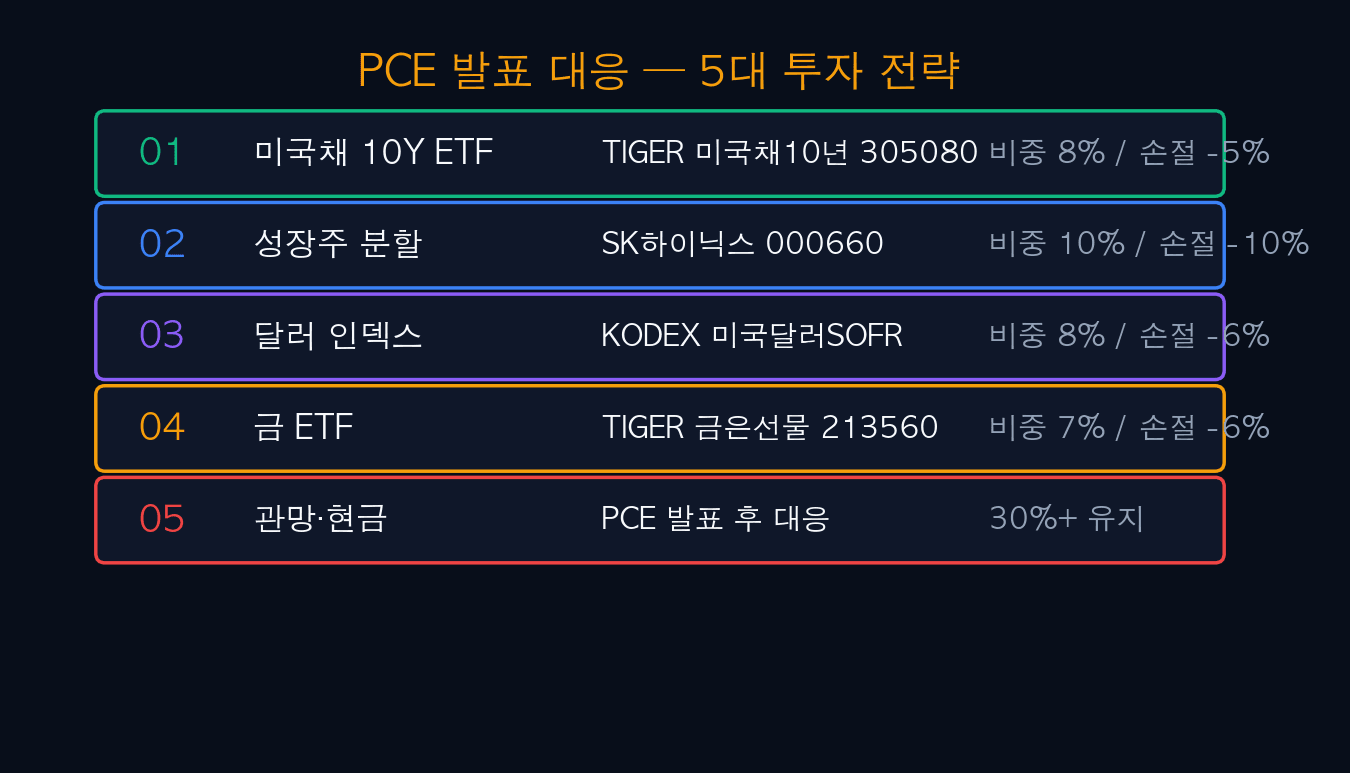
| Strategy | Instrument | Code | Stop-loss | Weight | Rationale |
|---|---|---|---|---|---|
| 1: US Treasury ETF | TIGER US 10Y Treasury | 305080 | -5% | 8% | Stable carry into June hold |
| 2: Growth stock | SK Hynix | 000660 | -10% | 10% | Rate stability + HBM momentum |
| 3: USD | KODEX US Dollar SOFR | — | -6% | 8% | Hedge if PCE prints hot |
| 4: Gold | TIGER Gold & Silver Futures | 213560 | -6% | 7% | Geopolitics + inflation hedge |
| 5: Cash | Cash hold | — | — | 30%+ | Dry powder for scaled entry |
First 10 minutes — no entries, peak volatility
30~60 minutes after — scale in once prices stabilize
Track FedWatch hold probability daily until the 6/16 FOMC
Read headline vs core PCE separately — the Fed only cares about core
If PCE prints hot, prepare for a -3% KOSDAQ gap-down — set stops in advance
Diversify: US Treasuries + growth + USD + gold + cash (four assets plus cash)
References
- BEA — Personal Consumption Expenditures Price Index (releasing 5/29)
- CME FedWatch Tool — June FOMC probability data
- Goldman Sachs Economic Research — Core PCE Outlook (May 2026)
- BLS — CPI April 2026 release
- Federal Reserve — Statement on longer-run goals (2025)
- CNBC Markets — Bulls push S&P near records (2026.05.23)
- Yahoo Finance — Bond market sends signal to Fed (2026.05.25)
This article is for informational purposes only and is not a recommendation to buy or sell any security or asset. It is based on public information as of May 26, 2026, and the actual PCE result may differ from the scenarios above. All investments — stocks, ETFs, bonds, crypto — carry the risk of capital loss, and investors are solely responsible for their decisions.