
Warren Buffett Value Investing Limits? Berkshire Worst S&P 500 Gap Since 2008 — 5 Diagnoses
Warren Buffett Value Investing Limits? Berkshire Worst S&P 500 Gap Since 2008 — 5 Diagnoses
Warren Buffett‘s Berkshire Hathaway (BRK.A·BRK.B) is enduring its worst relative underperformance since 2008. The BRK.A/SPY (Berkshire vs S&P 500) ratio has plunged from its 2024~2025 peak, evaluated as the “most severe relative slump since immediately before the 2008 financial crisis” per Benzinga. The S&P 500’s rally is led by AI mega-caps like Nvidia and Microsoft, while Berkshire — anchored in insurance, rail, energy, and consumer staples — has lagged.
This article synthesizes Benzinga, Berkshire IR, Bloomberg, and Seeking Alpha to cover Warren Buffett value-investing limits: BRK.A/SPY relative performance, 5 reasons for the lag, Berkshire portfolio breakdown, record cash hoard of $360B, successor Greg Abel’s takeover schedule, value vs growth comparison, cyclical vs structural-change hypotheses, and 5 balanced investment strategies. Berkshire official materials at Berkshire Hathaway.
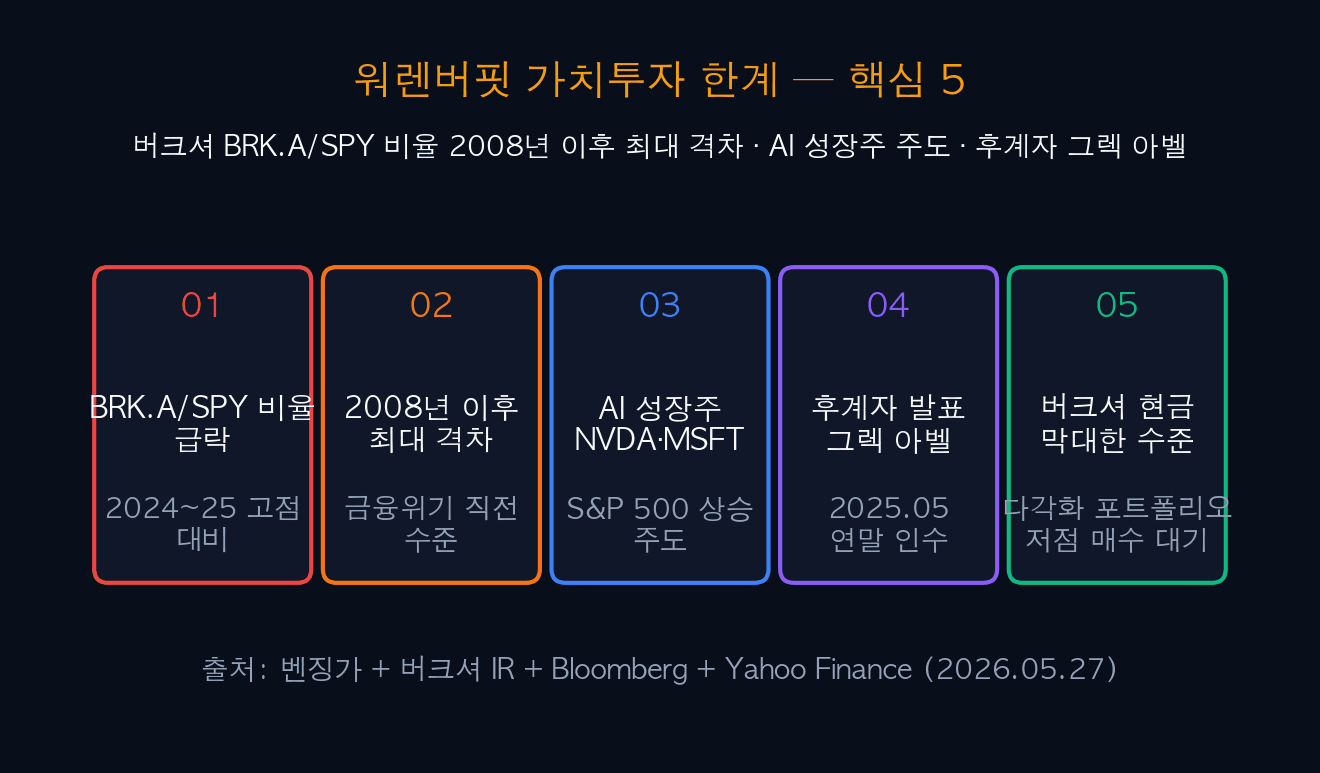
| Item | Value | Notes |
|---|---|---|
| BRK.A/SPY Ratio | Plunge from 2024~25 peak | Worst gap since 2008 |
| Driver | AI mega-caps NVDA·MSFT lead | S&P 500 rally |
| Berkshire Biz | Insurance·rail·energy·staples | No AI license exposure |
| Cash Hoard | ~$360B (record high) | Net seller / defensive |
| Successor | Greg Abel (announced 2025.05) | Takes over end-2025 |
| Top Holding | Apple (~40%) + KO·AmEx | Single largest position |
| Open Question | Cyclical slump vs structural change | Per Benzinga |
01BRK.A vs S&P 500 — Relative Performance Since 2008
The ratio of Berkshire Hathaway Class A (BRK.A) to S&P 500 SPDR ETF (SPY) is the leading proxy for value investing vs broad market performance. With 2008 financial crisis as baseline 100, the ratio rose to ~135 by 2024 — favoring value — but has tumbled to ~105 in 2025~2026, the most severe relative slump since 2008.
The ~105 level in May 2026 is nearly identical to immediately before the 2008 crisis. Per Benzinga, “value investing strategy is failing to keep pace with the growth-stock rally”, and whether this relative weakness is cyclical or structural remains the core unanswered question.
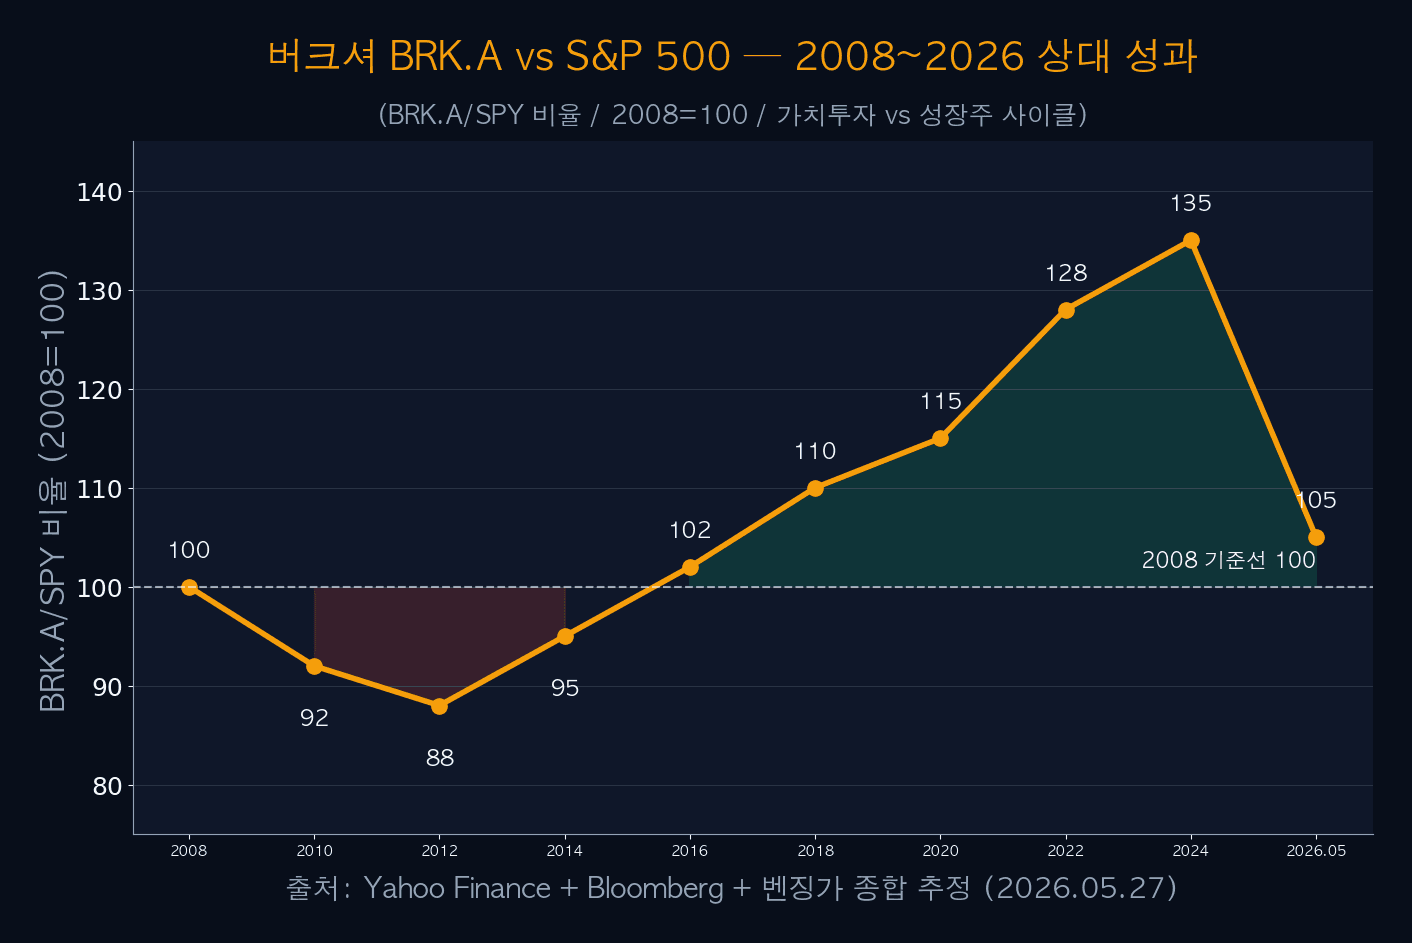
| Year | BRK.A/SPY Ratio | Key Event | Assessment |
|---|---|---|---|
| 2008 | 100 | Right before financial crisis | Baseline |
| 2010 | 92 | Early recovery | Growth ahead |
| 2014 | 95 | Fed QE ends | Recovery in progress |
| 2018 | 110 | Berkshire expands Apple | Value ahead |
| 2020 | 115 | COVID + safe-haven | Value ahead |
| 2022 | 128 | Rate hikes + value rotation | Strong value |
| 2024 | 135 (peak) | Berkshire all-time high | Value peak |
| 2026.05 | 105 (plunge) | AI mega-cap leadership | Worst gap since 2008 |
iINFO — Meaning of “Worst Gap Since 2008”
“Most severe relative slump since 2008” refers to the drawdown of the BRK.A/SPY ratio from its peak, not just price comparison. Falling from peak 135 (2024) to ~105 (2026.05) is about a -22% relative drawdown, the largest such gap since just before the 2008 crisis.
02Why Value Fell Behind Growth — 5 Factors
Berkshire’s relative weakness stems from 5 compounding factors, not a single cause. AI mega-cap leadership + traditional business mix + rate-cut cycle + ETF/passive concentration + Buffett’s selling signals.
The biggest factor is AI mega-cap leadership. NVDA·MSFT·META·GOOGL drove the S&P 500 higher while Berkshire has effectively no direct AI exposure — a decisive differentiator. Auto-concentration of ETF and passive flows into mega-caps also structurally sidelines value names.
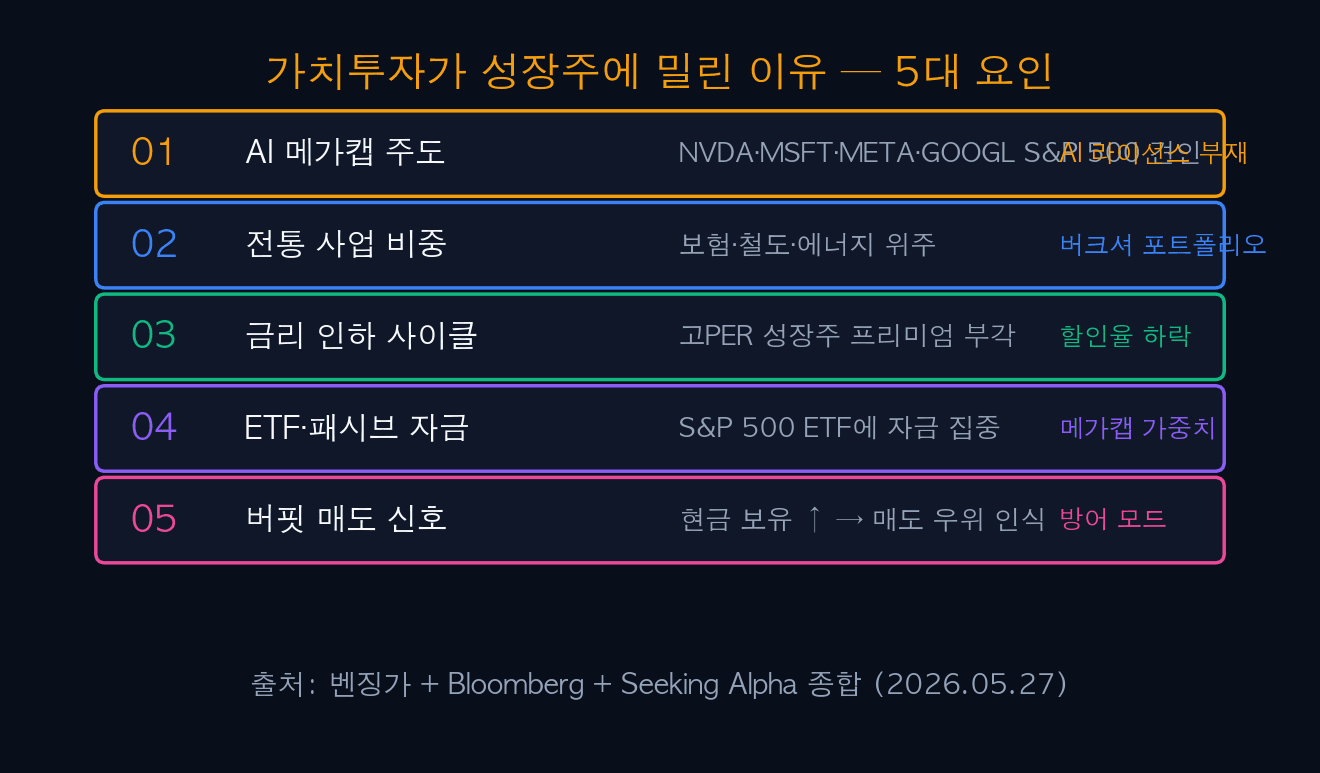
| Factor | Core Content | Strength |
|---|---|---|
| 1. AI Mega-Cap Lead | NVDA·MSFT·META·GOOGL drive S&P 500 | Very Strong |
| 2. Traditional Mix | Insurance·rail·energy heavy | Very Strong |
| 3. Rate-Cut Cycle | Premium for high-PER growth | Strong |
| 4. ETF/Passive Flows | Concentrated in S&P 500 ETFs | Strong |
| 5. Buffett Selling Signal | Cash up → market read as net seller | Moderate |
| 6. Successor Uncertainty | Greg Abel transition concerns | Moderate |
03Berkshire Core Portfolio — Traditional Business Heavy
Berkshire Hathaway is broadly composed of 5 segments. Insurance ~30%, Rail (BNSF) ~15%, Energy (BHE) ~12%, Consumer·Manufacturing ~10%, Stock Portfolio ~33%. Within stocks, Apple represents ~40% — the largest single position.
The portfolio profile emphasizes “predictable cash flows + strong moats + stable dividends“. Insurance·rail·energy are heavily regulated with low volatility but limited rapid growth. Beyond Apple, Coca-Cola·American Express·Bank of America anchor the stock portfolio, with very limited direct AI exposure.
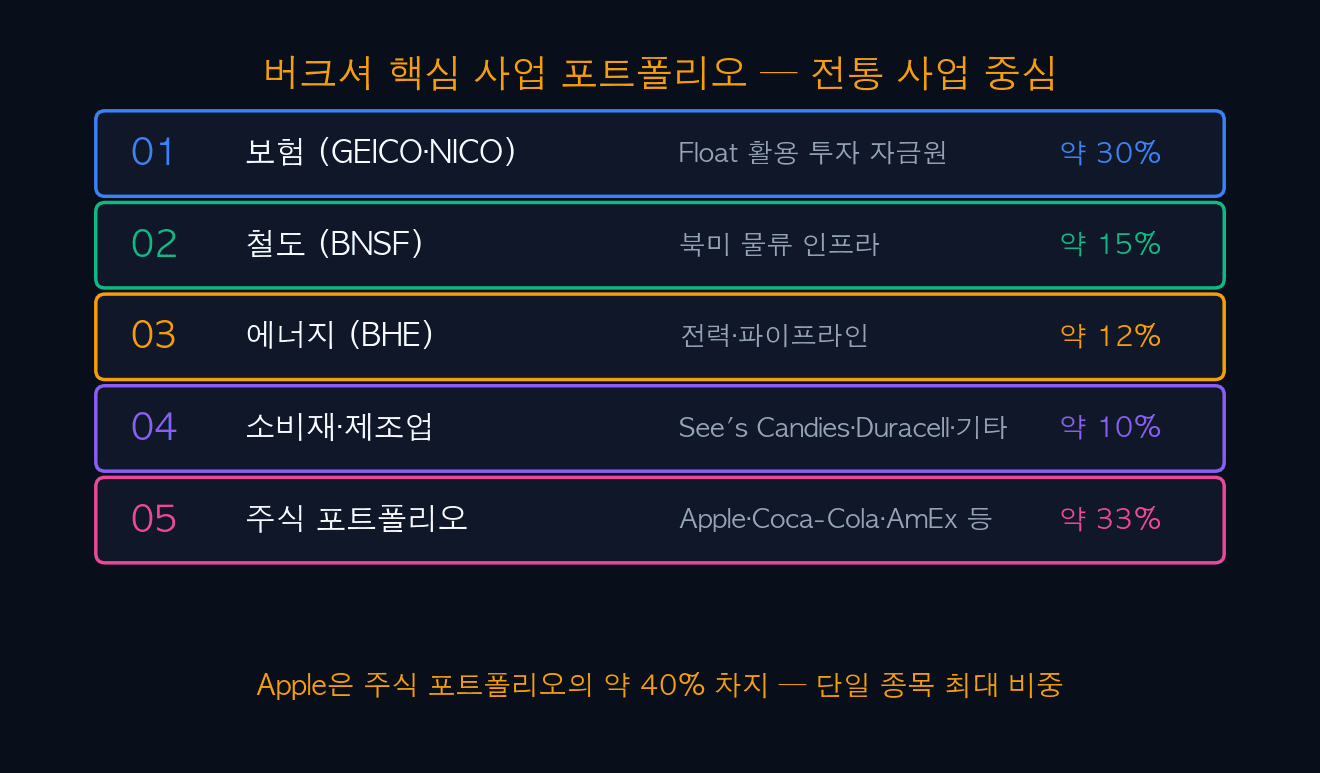
| Segment/Portfolio | Key Assets | Share | Notes |
|---|---|---|---|
| Insurance | GEICO·NICO·General Re | ~30% | Float funds investment |
| Rail | BNSF Railway | ~15% | North American logistics |
| Energy | Berkshire Hathaway Energy (BHE) | ~12% | Power·pipelines |
| Consumer·Mfg | See’s Candies·Duracell·Lubrizol·Marmon | ~10% | Traditional brands |
| Stock Portfolio | Apple(~40%)·KO·AXP·BAC·OXY | ~33% | Apple largest |
| Direct AI Exposure | Very Limited | — | Berkshire’s weak point |
!WARNING — Apple Concentration Risk
About 40% of Berkshire’s stock portfolio is concentrated in Apple (AAPL). Apple is an IT mega-cap but Berkshire frames it as a “consumer brand·customer-loyalty” play. Still, if Apple falls behind in AI competition, the shock transmits directly to Berkshire’s portfolio.
04Record $360B Cash Hoard — Defensive Mode
As of May 2026, Berkshire holds about $360B in cash and Treasuries — a record high. Rising from $140B in 2020 to $325B in 2024 and now $360B, the market reads this as “Buffett sees the market as expensive“.
Buffett has repeatedly noted “a shortage of attractive buying opportunities” in shareholder letters. Recent quarters saw Berkshire partially trimming Apple and BAC, accumulating cash. This defensive stance has two faces: a short-term headwind for value, but also enormous dry powder for buying drawdowns — a potential catalyst for long-term re-rating.
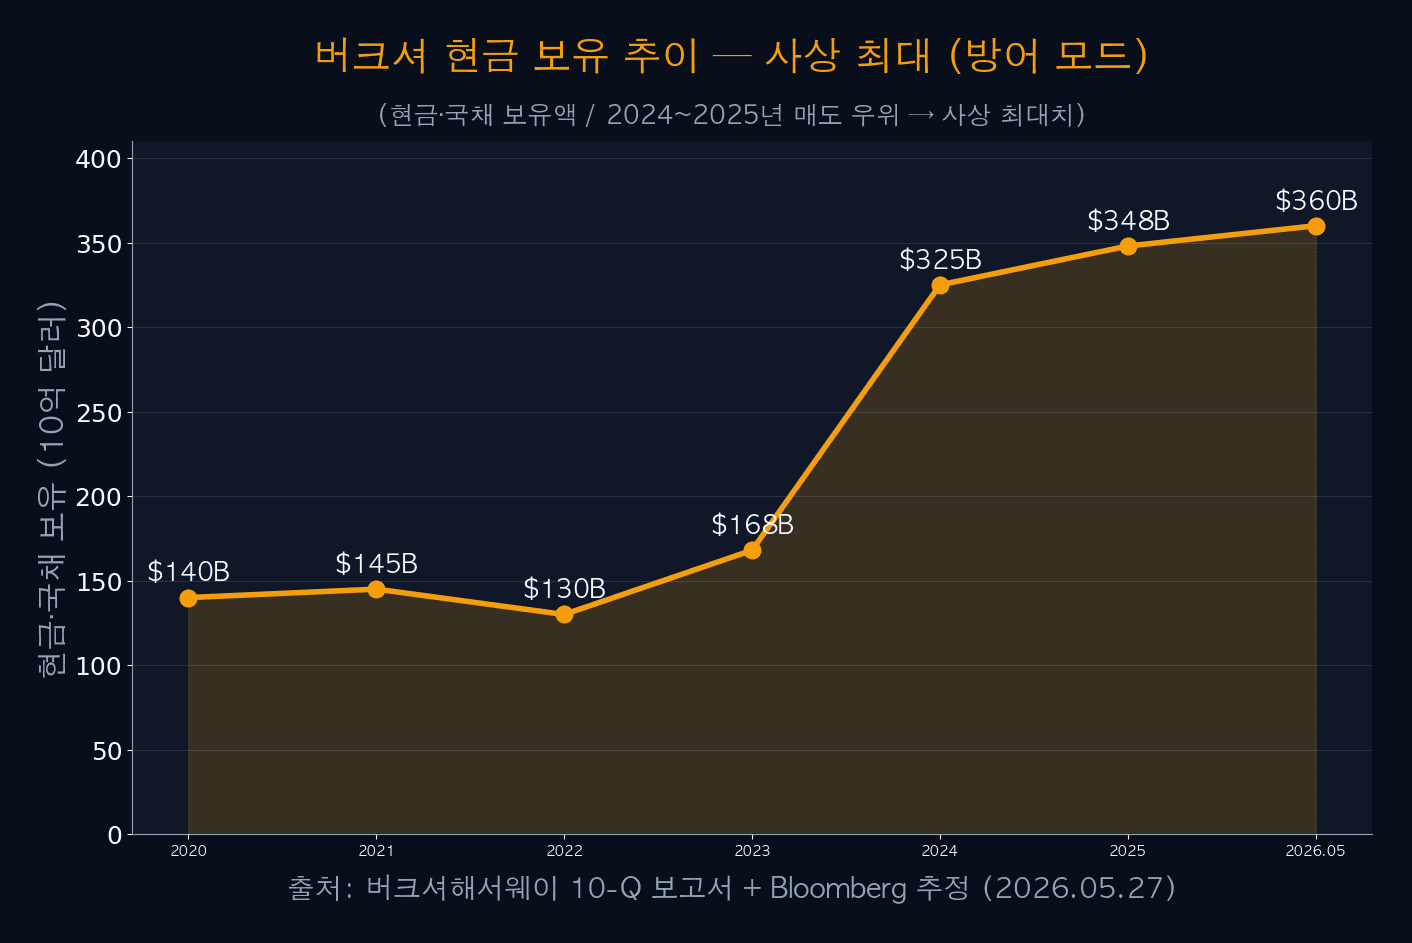
| Year | Cash·Treasuries ($B) | Key Trends | Interpretation |
|---|---|---|---|
| 2020 | $140 | COVID + limited buying | Steady |
| 2021 | $145 | Recovery + maintain | Watching |
| 2022 | $130 | Occidental purchases | Selective buys |
| 2023 | $168 | Cash accumulation starts | Watch intensified |
| 2024 | $325 | Apple·BAC partial sells | Record high |
| 2025 | $348 | Defensive mode persists | Continued watching |
| 2026.05 | $360 | New high | Market “expensive” signal |
05Successor Greg Abel — End-2025 Takeover
In May 2025, Berkshire Hathaway formally announced Greg Abel as next CEO. Born in Canada in 1962, Abel chairs and vice-chairs BHE (Berkshire Hathaway Energy), known for strong operational management and data-driven decision making in energy. Takeover is scheduled for end-2025, with Buffett stepping back from chair to honorary chair.
The key question for the Abel era: how will Berkshire’s portfolio evolve. He is expected to retain value-investing essentials while gradually expanding AI·tech exposure. In investments, Todd Combs and Ted Weschler are CIO candidates, already managing portions of the stock portfolio.
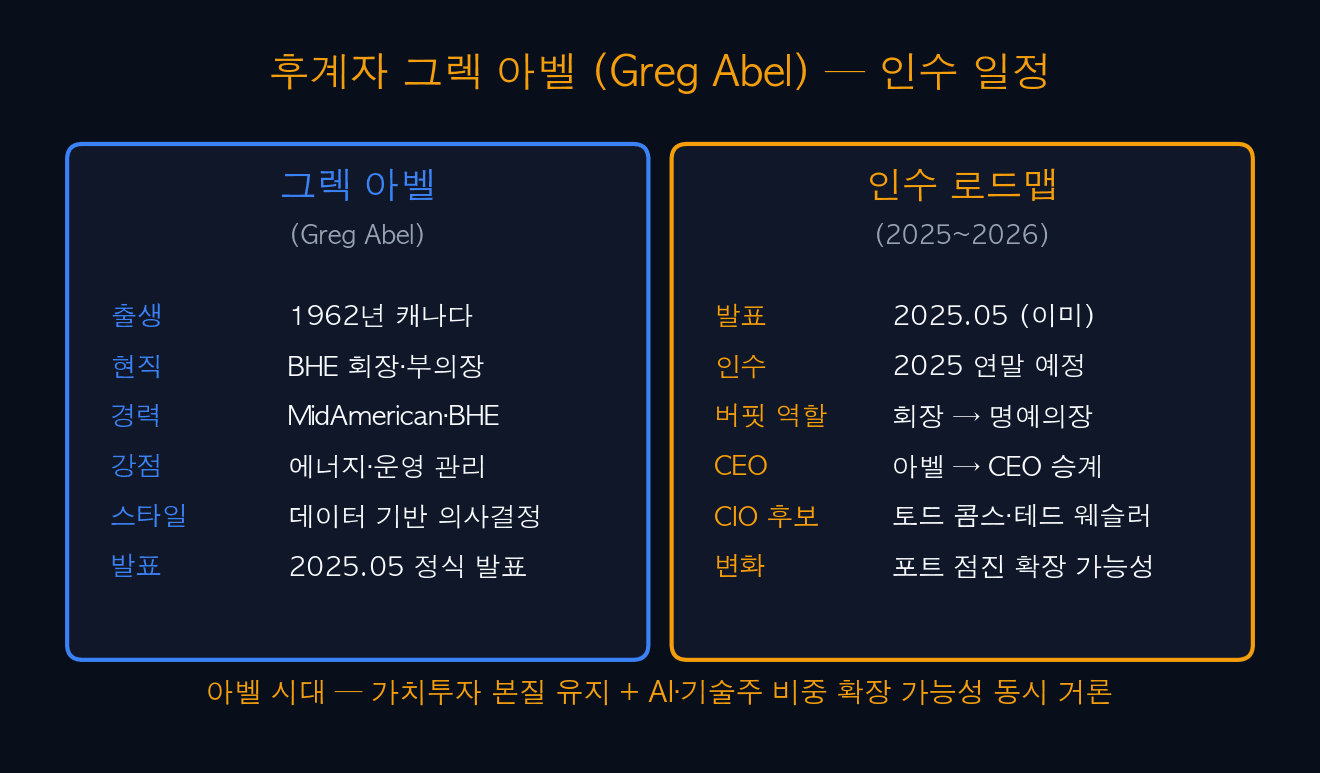
| Item | Content | Notes |
|---|---|---|
| Announcement | 2025.05 formal | Buffett’s direct nomination |
| Born | 1962, Canada | Age 63~64 |
| Current | Chairman·Vice-Chair of BHE | Energy operations |
| Takeover | End-2025 expected | Phased transition |
| Buffett Role | Chair → Honorary Chairman | Shareholder letters continue |
| CIO Candidates | Todd Combs·Ted Weschler | Stock portfolio mgmt |
| Change Bias | Gradual AI·tech expansion | Value essentials kept |
✓TIP — Successor Risk and Opportunity
Successor transitions cut both ways. (1) Risk — loss of Buffett charisma·judgment may add temporary volatility, (2) Opportunity — if Abel expands AI·tech, Berkshire’s portfolio can be re-rated. Long-term investors can use end-2025~early-2026 volatility windows for phased buying.
06Value vs Growth — 5 Core Comparisons
Neither value nor growth is absolutely superior — leadership rotates by market cycle. Five core comparisons: PER, growth rate, stability, dividend, innovation exposure.
The market is currently in a growth-favored phase as AI cycles run strong, but a return to value cycles is plausible depending on rates·earnings·geopolitics. Long-term investors should hold a balanced value-growth portfolio rather than betting 100% on either side.
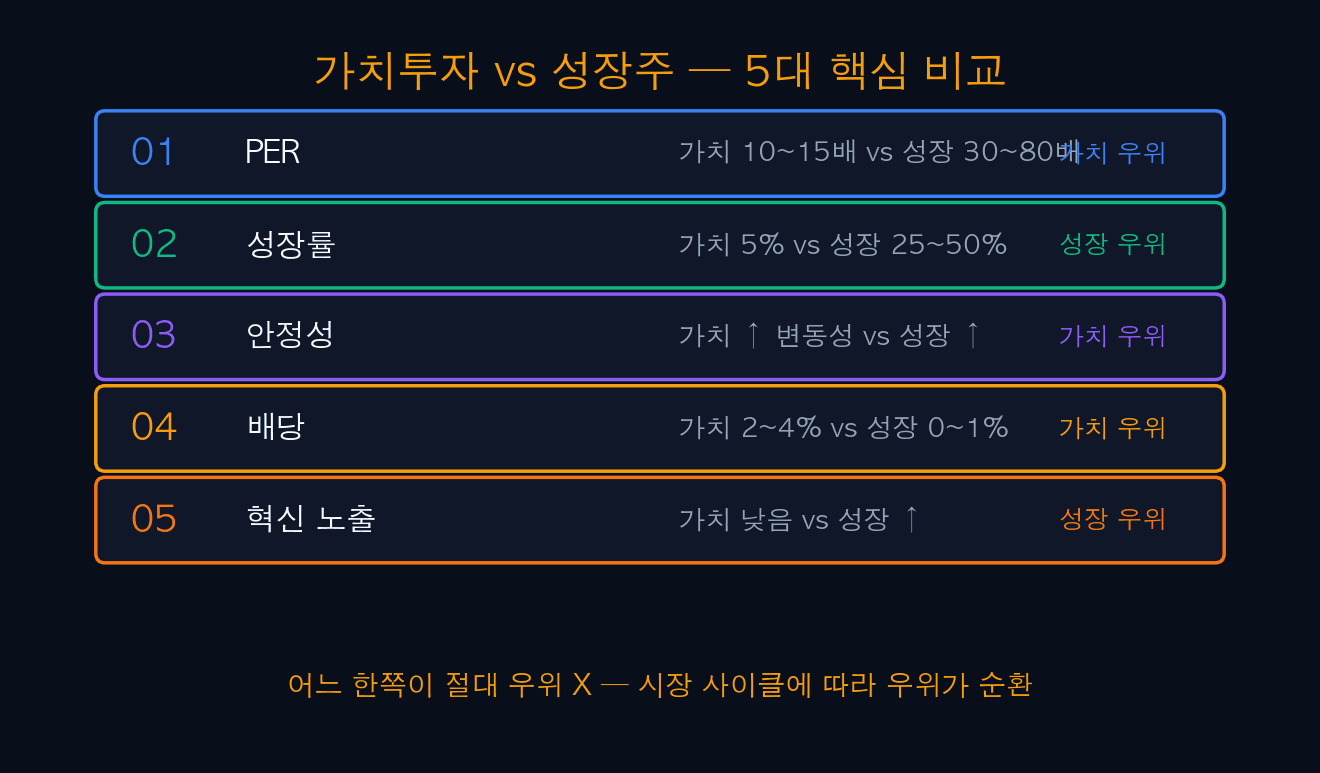
| Item | Value (BRK etc.) | Growth (NVDA etc.) | Current Edge |
|---|---|---|---|
| PER | 10~15x | 30~80x | Value |
| Growth Rate | 5% | 25~50% | Growth |
| Stability | Low vol | High vol | Value |
| Dividend | 2~4% | 0~1% | Value |
| Innovation | Low | Very strong | Growth |
| Current Market | Relative weakness | Rally leader | Growth cycle |
iINFO — 60/40 Balance Strategy
A standard long-term strategy: 60% broad market (S&P 500) + 40% value/dividend. In AI bull cycles, the 60% broad market drives returns; in value cycles, the 40% value/dividend defends. Berkshire BRK.B offers “value + diversification” exposure in a single ticker.
07Cyclical Slump vs Structural Change — Open Question
Benzinga frames it as “an open question whether this is cyclical or structural“. Both hypotheses have merit.
Cyclical hypothesis: if AI cycles peak and correct, value rotation kicks in. Berkshire’s $360B cash becomes drawdown ammunition, and successor Greg Abel can engineer fresh momentum. Structural-change hypothesis: AI permanently transforms the tech-economy paradigm, ETF/passive flows lock into mega-caps, and traditional businesses lose share permanently. Value-investing strategy’s efficacy weakens and the gap may not close even with rate normalization.
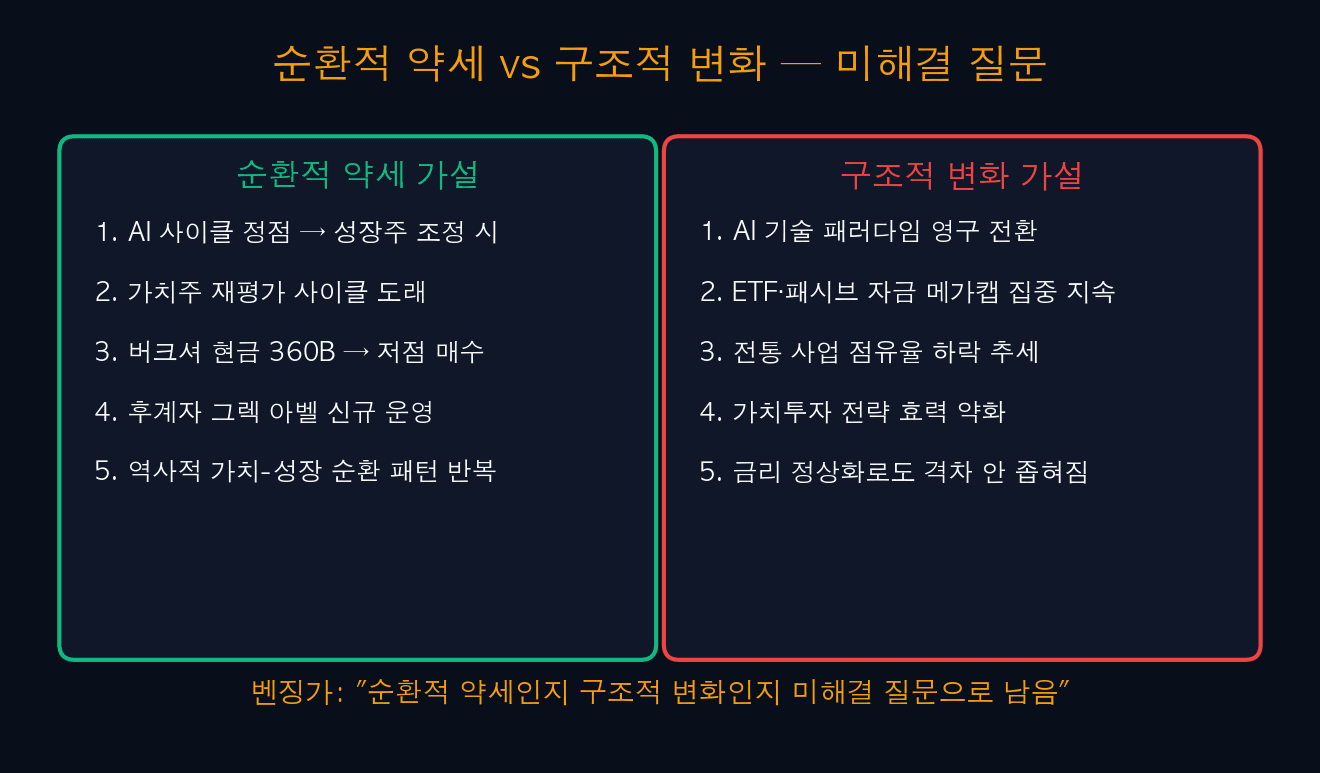
| Hypothesis | Core Logic | Supporting Evidence |
|---|---|---|
| Cyclical | AI peak → value re-rating | Historical value-growth cycles |
| Cyclical | Berkshire $360B → buy drawdowns | Record cash |
| Cyclical | Greg Abel fresh momentum | End-2025 takeover |
| Structural | AI paradigm permanent shift | Tech-economy restructure |
| Structural | ETF/passive mega-cap lock-in | Permanent flow concentration |
| Structural | Value strategy efficacy weakens | Gap persists despite rate normalization |
⚠ALERT — Neither Hypothesis Confirmed Yet
Which view wins will likely be determined by 2026~2027 AI earnings and rate cycle outcomes. Betting 100% on one hypothesis is risky; balanced exposure to both scenarios is safer.
08Warren Buffett Value Investing — 5 Strategies
Five investment strategies drawn from the Buffett case: BRK.B phased buying + S&P 500 ETF + dividend ETF + AI mega-cap core + 20% cash. Avoid betting 100% on either side — balance value-growth-cash with three pillars to handle cycle volatility.
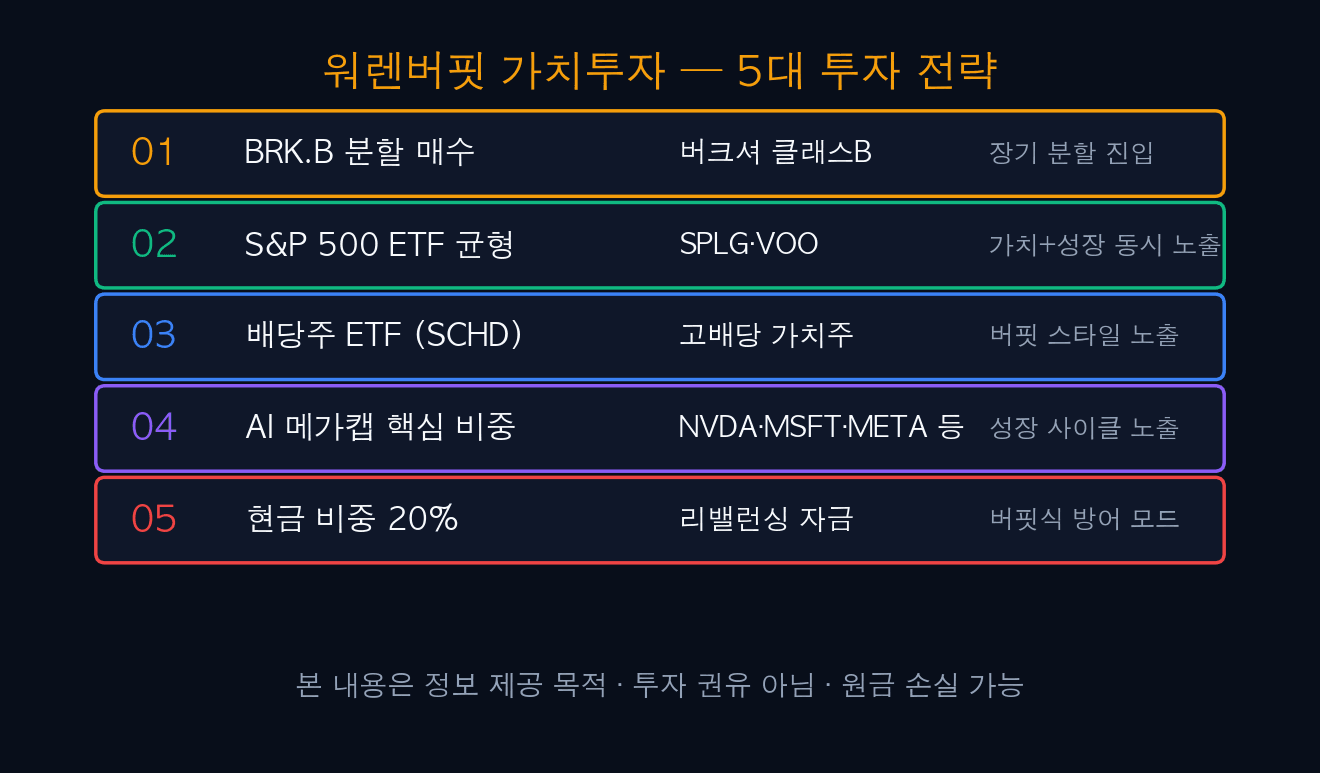
| Strategy | Ticker | Allocation | Rule |
|---|---|---|---|
| S1: BRK.B | Berkshire Class B | 10~15% | -15% stop |
| S2: S&P 500 ETF | SPLG·VOO | 30~40% | Long-term hold |
| S3: SCHD | Dividend ETF | 10~15% | -10% stop |
| S4: AI Mega-Cap | NVDA·MSFT·META·GOOGL | 20~30% | Quarterly earnings |
| S5: Cash Allocation | Rebalancing reserve | 20% | Flexible |
- Status: BRK.A/SPY worst gap since 2008 (Benzinga)
- Drivers: AI mega-cap leadership + traditional mix + passive flows
- Berkshire biz: Insurance·rail·energy·staples + Apple ~40%
- Cash: ~$360B record high (defensive)
- Successor: Greg Abel — end-2025 takeover
- CIO candidates: Todd Combs·Ted Weschler
- Hypothesis: Cyclical slump vs structural change (open)
- Balanced strategy: BRK.B + S&P 500 + SCHD + AI + 20% cash
- No single-bet — diversify value·growth·cash
🔗 [This] Warren Buffett Value Investing Limits? Berkshire Worst S&P 500 Gap Since 2008 — 5 Diagnoses
🔗 [Related] US Space Force SpaceX $2.29B Contract — Golden Dome SDN Backbone
🔗 [Related] Yen Depreciation Hits 1973 Low — 5 Causes Outlook
🔗 [Related] MakinaRocks 477850 Stock Outlook 5/27 — Korea’s Palantir 5 Scenarios
🔗 [Related] Samjeonix Leverage ETF May 27 Launch — 18 Products + 5 Strategies
🔗 [Next] Greg Abel Takeover D-Day Berkshire Portfolio Changes (Planned)
#WarrenBuffett
#BerkshireHathaway
#BRKA
#BRKB
#ValueInvesting
#ValueInvestingLimits
#SP500ETF
#SPY
#NVIDIA
#NVDA
#Microsoft
#MSFT
#AIMegaCap
#GrowthStocks
#GregAbel
#Successor
#Apple
#CocaCola
#AmericanExpress
#DividendETF
#SCHD
#SP500Strategy
#CyclicalSlump
#StructuralChange
#Cash360B
#DefensiveMode
#getdirEconomicInsights
#getdirBuffett
#jyfamilyoffice
#2026Investing