Silver Price Forecast 2026 — $121 ATH to $76, Gold/Silver Ratio 55:1 & Three June Scenarios
Economy · May 17, 2026 · ~6 min read
Silver price forecast 2026: after surging to an all-time high of $121/oz in April, silver has corrected sharply to $76 — a 37% drawdown. The gold/silver ratio has compressed to 55:1, well below the 10-year average of 80:1, signaling structural silver strength. Three industrial mega-trends, six institutional forecasts, and three June scenarios analyzed.

1. Silver Price Forecast 2026 — One-Year Trend & Gold/Silver Ratio Analysis

The silver price forecast 2026 begins with a remarkable 12-month journey. Silver traded near $30/oz in May 2025. By April 2026 it had rallied to an all-time high of $121/oz — a 303% surge driven by industrial demand, safe-haven flows, and a dollar weakening cycle. The April peak was followed by a sharp correction: silver sits at $76/oz as of May 17, down 37% from the ATH.
The correction is steep but the structural picture remains constructive. The gold/silver ratio at 55:1 is far below the 10-year average of 80:1, meaning silver is relatively expensive versus gold by historical standards — yet this ratio compression reflects genuine industrial re-rating, not speculative excess. When gold trades at $4,180 and silver at $76, the ratio implies silver has already repriced from a “monetary metal” to a “technology metal.”

Korean investors note: at a JPY/KRW rate of 9.42 and silver at $76, the KRW-equivalent silver price is approximately ₩107,600/oz. The ATH of $121 translated to ₩171,200/oz at April’s exchange rate — Korean investors who bought below ₩70,000/oz in 2025 are still sitting on substantial gains despite the correction.
2. Three Industrial Mega-Trends Driving Silver + Supply-Demand Structural Deficit

- Solar energy expansion — Silver paste is irreplaceable in photovoltaic cells. Global solar capacity additions hit a record in 2025; the IEA projects another 15% increase in 2026. Silver demand from solar alone reached 230 Moz in 2025, up 34% YoY. No viable substitute exists at commercial scale.
- EV battery systems — Silver is used in EV battery management systems, charging contacts, and power electronics. Global EV sales topped 20 million units in 2025. Silver EV demand grew 28% YoY to 88 Moz. BYD and Tesla’s next-generation platforms increase silver content per vehicle.
- AI data center infrastructure — Silver’s unmatched electrical conductivity makes it essential for high-density server interconnects and cooling systems. AI data center construction is accelerating globally; silver demand from this sector grew 19% YoY and is forecast to double by 2028.

Total silver demand in 2026 is projected at 1,320 Moz against mine supply of 820 Moz — a structural deficit of 500 Moz (38%). This is the fifth consecutive year of deficit. UBS revised its deficit estimate downward by 80% in May (citing improved recycling rates and demand moderation), but even the revised figure remains structurally bullish: above-ground inventories continue to draw down.
3. Six Institutional Forecasts + Three June Scenarios for the Silver Price
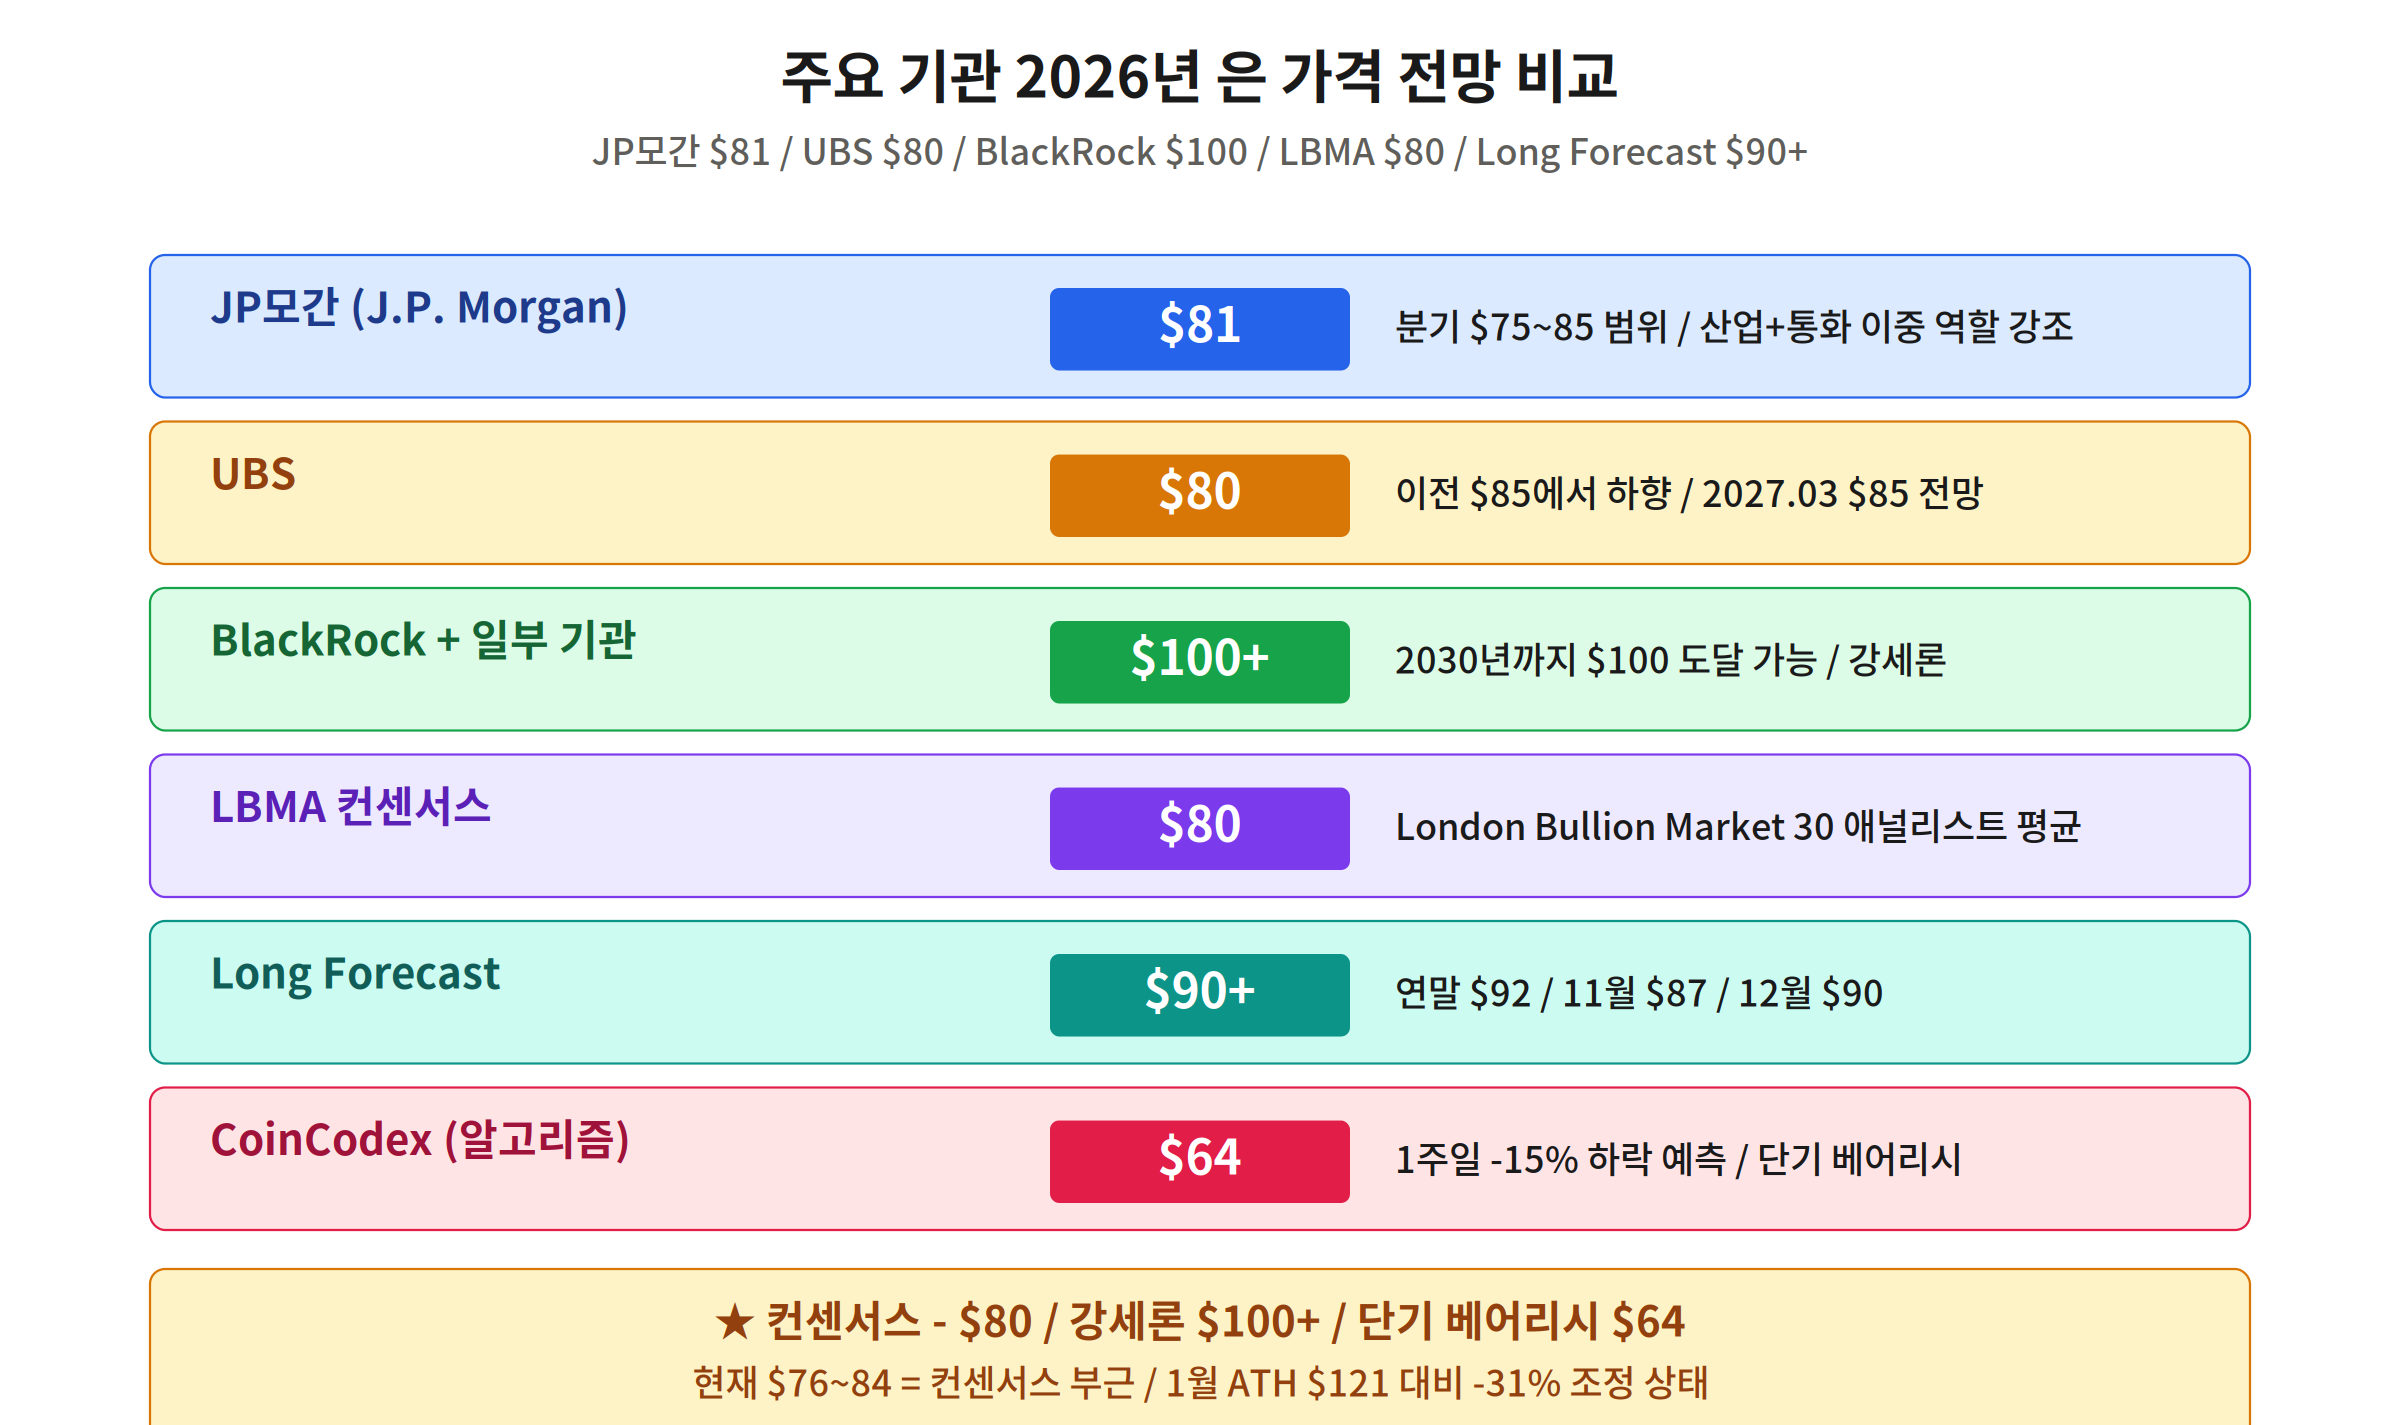
| Institution | Forecast | Basis |
|---|---|---|
| JP Morgan | $81/oz | Industrial demand + mild USD weakness |
| UBS | $80/oz | Deficit revised down 80%; cautious |
| BlackRock | $100+ | Structural deficit + safe-haven premium |
| LBMA Survey | $80/oz | Consensus of 30 dealers |
| Long Forecast | $92/oz | Technical: ATH retest potential |
| CoinCodex | $64/oz | Bearish: oversupply from recycling surge |
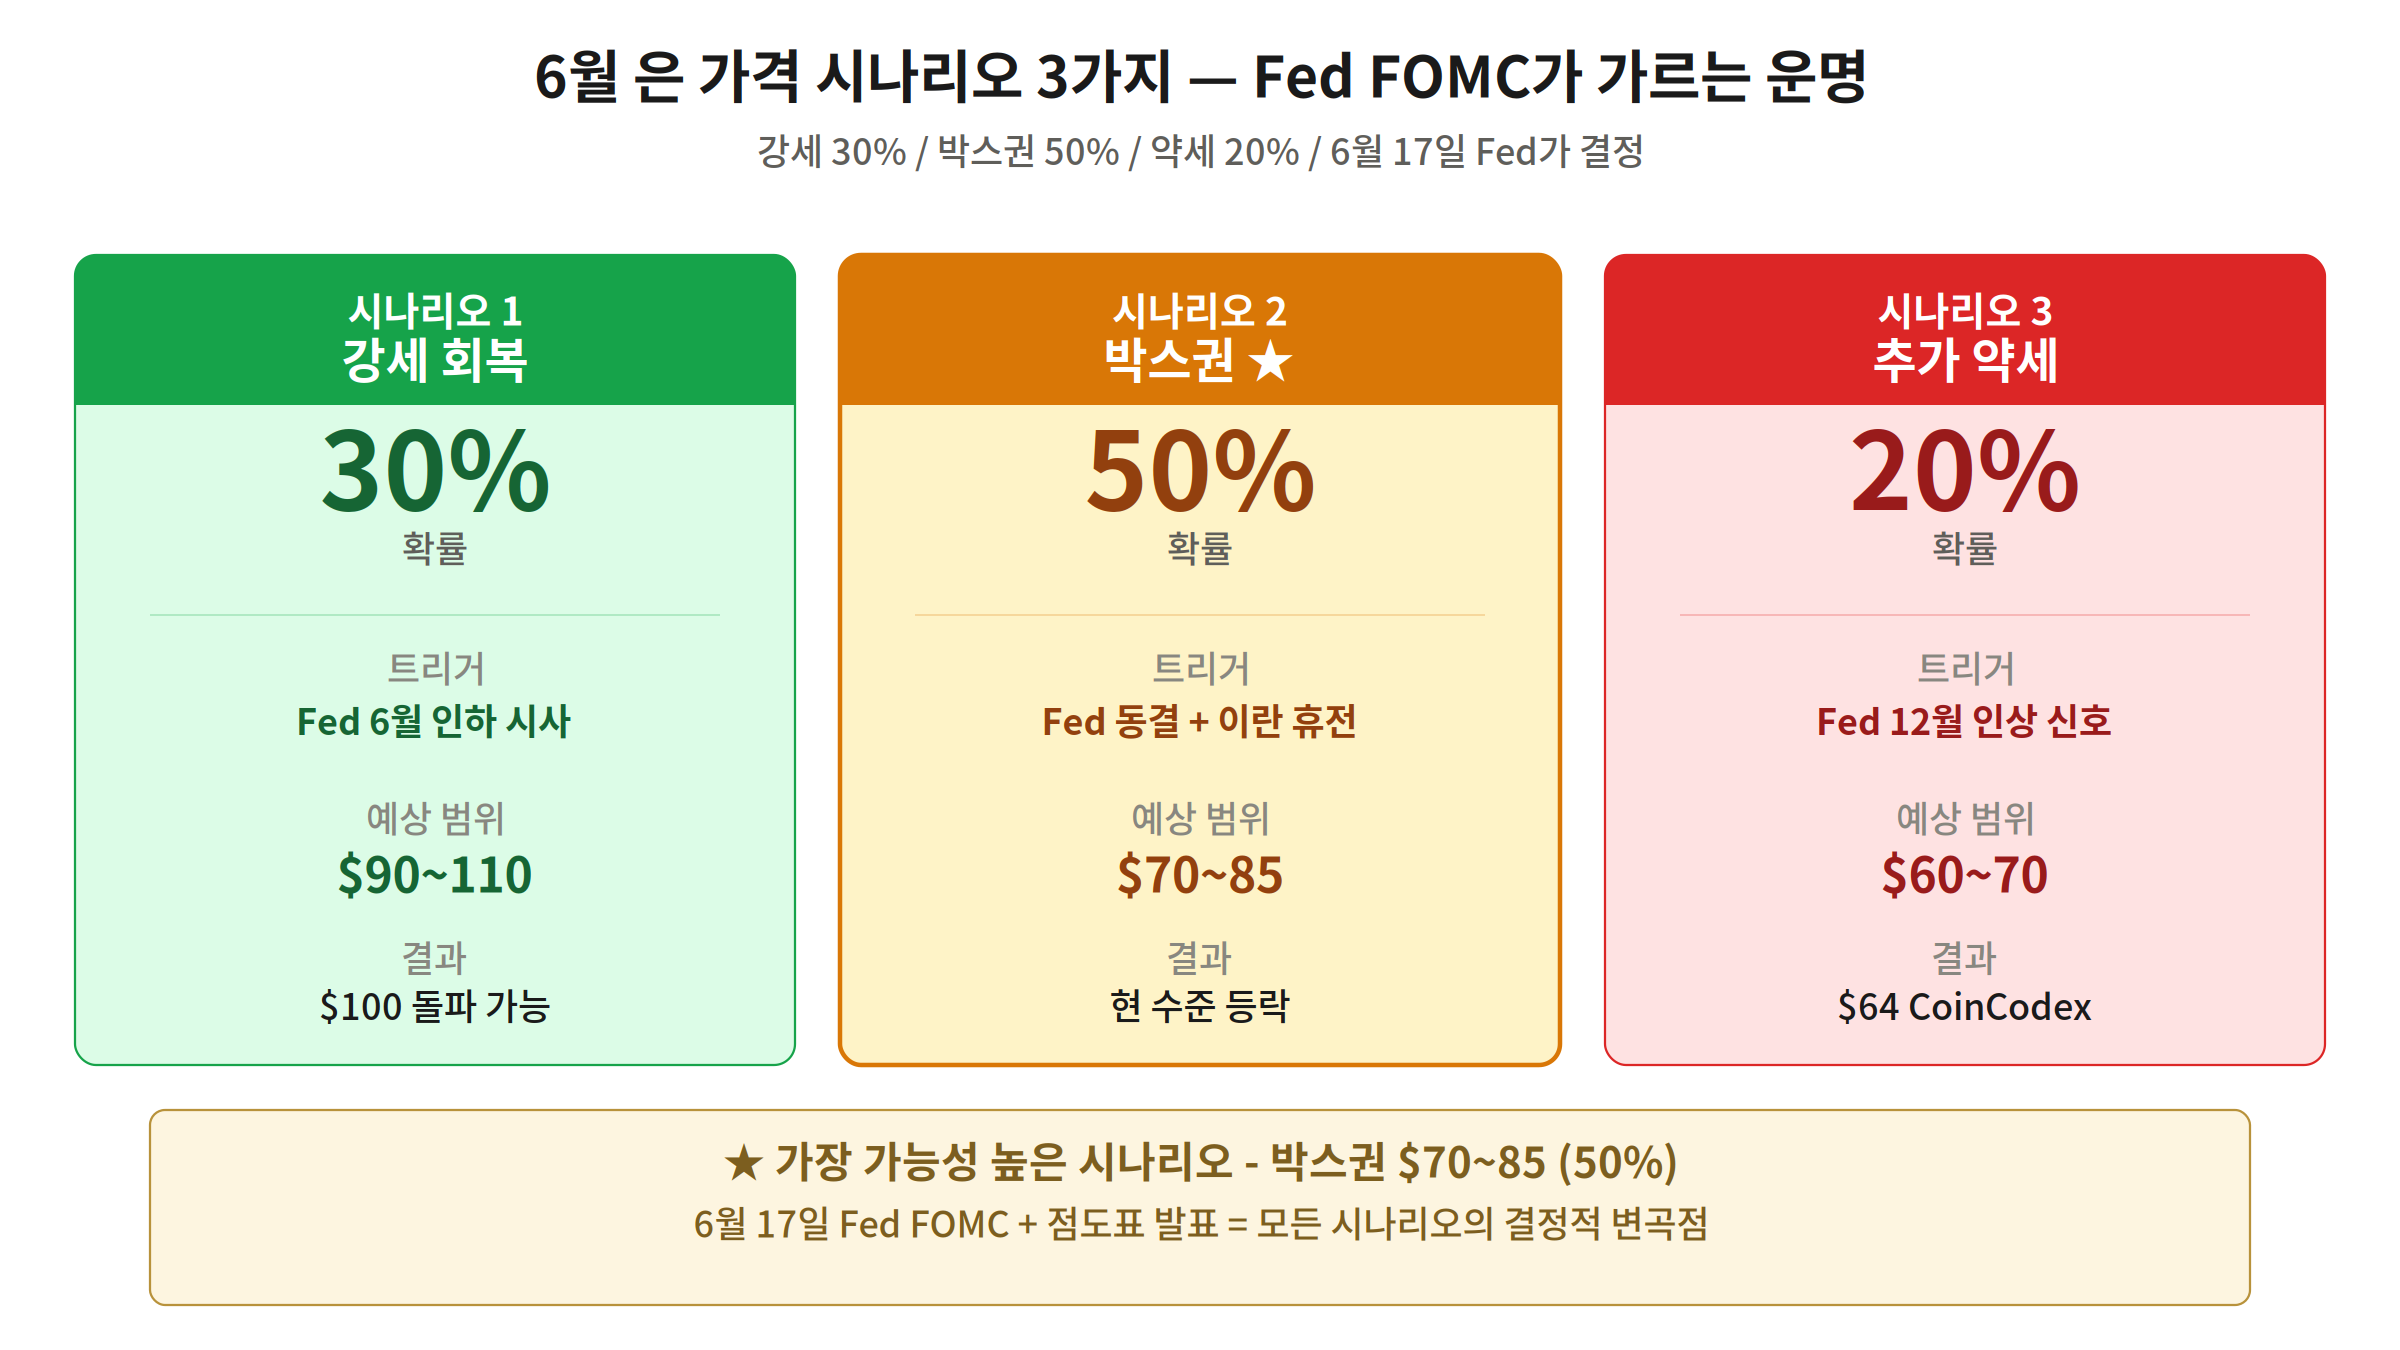
| Scenario | Probability | Trigger | Target Range |
|---|---|---|---|
| ① Bullish rebound | 30% | Iran ceasefire + Fed cut signal + solar demand surge | $92–$105 |
| ② Range-bound ★ | 50% | Deficit persists, rate uncertainty continues | $76–$88 |
| ③ Further correction | 20% | Dollar strength + UST 4.6%+ + recycling surge | $64–$72 |
Probability-weighted June-end silver price forecast: $84/oz. The range-bound scenario (50%) dominates because the structural deficit provides a floor while the Fed uncertainty and dollar strength cap upside. The June 17 FOMC is the decisive inflection point: a dovish signal from new Fed Chair Kevin Warsh could quickly unlock the bullish scenario.
4. Five Investment Strategies for Korean Investors + Daily Monitoring Signals

- Physical silver DCA — Korea Exchange (KRX) silver products or KGEX (Korea Gold Exchange) silver bars. Buy in tranches: 1/3 now ($76), 1/3 at $70, 1/3 at $64. Long-term hold targeting $90+.
- Silver ETF (domestic) — TIGER Silver Futures ETF or KODEX Silver Futures ETF on KRX. Liquid, no storage cost, tracks LME silver. Note: contango roll cost ~3–5% annually reduces long-term returns vs. physical.
- Silver mining stocks — First Majestic Silver (AG), Pan American Silver (PAAS), KGHM (KGH). Miners offer 2–3× leverage to silver price moves but carry operational risk. Suitable for aggressive allocation only.
- Gold/silver ratio arbitrage — At 55:1 (below 80:1 average), ratio is already compressed. If ratio reverts toward 70:1 with gold flat at $4,180, silver would fall to $60. Ratio arbitrage works best when ratio is above 80:1 — current entry is not optimal for this strategy.
- FX-hedged vs. unhedged selection — With KRW/USD at ₩1,497 (near ₩1,500), unhedged silver ETFs benefit from both silver price rises and further won weakness. At current FX levels, unhedged (UH) ETFs are preferred for silver exposure.
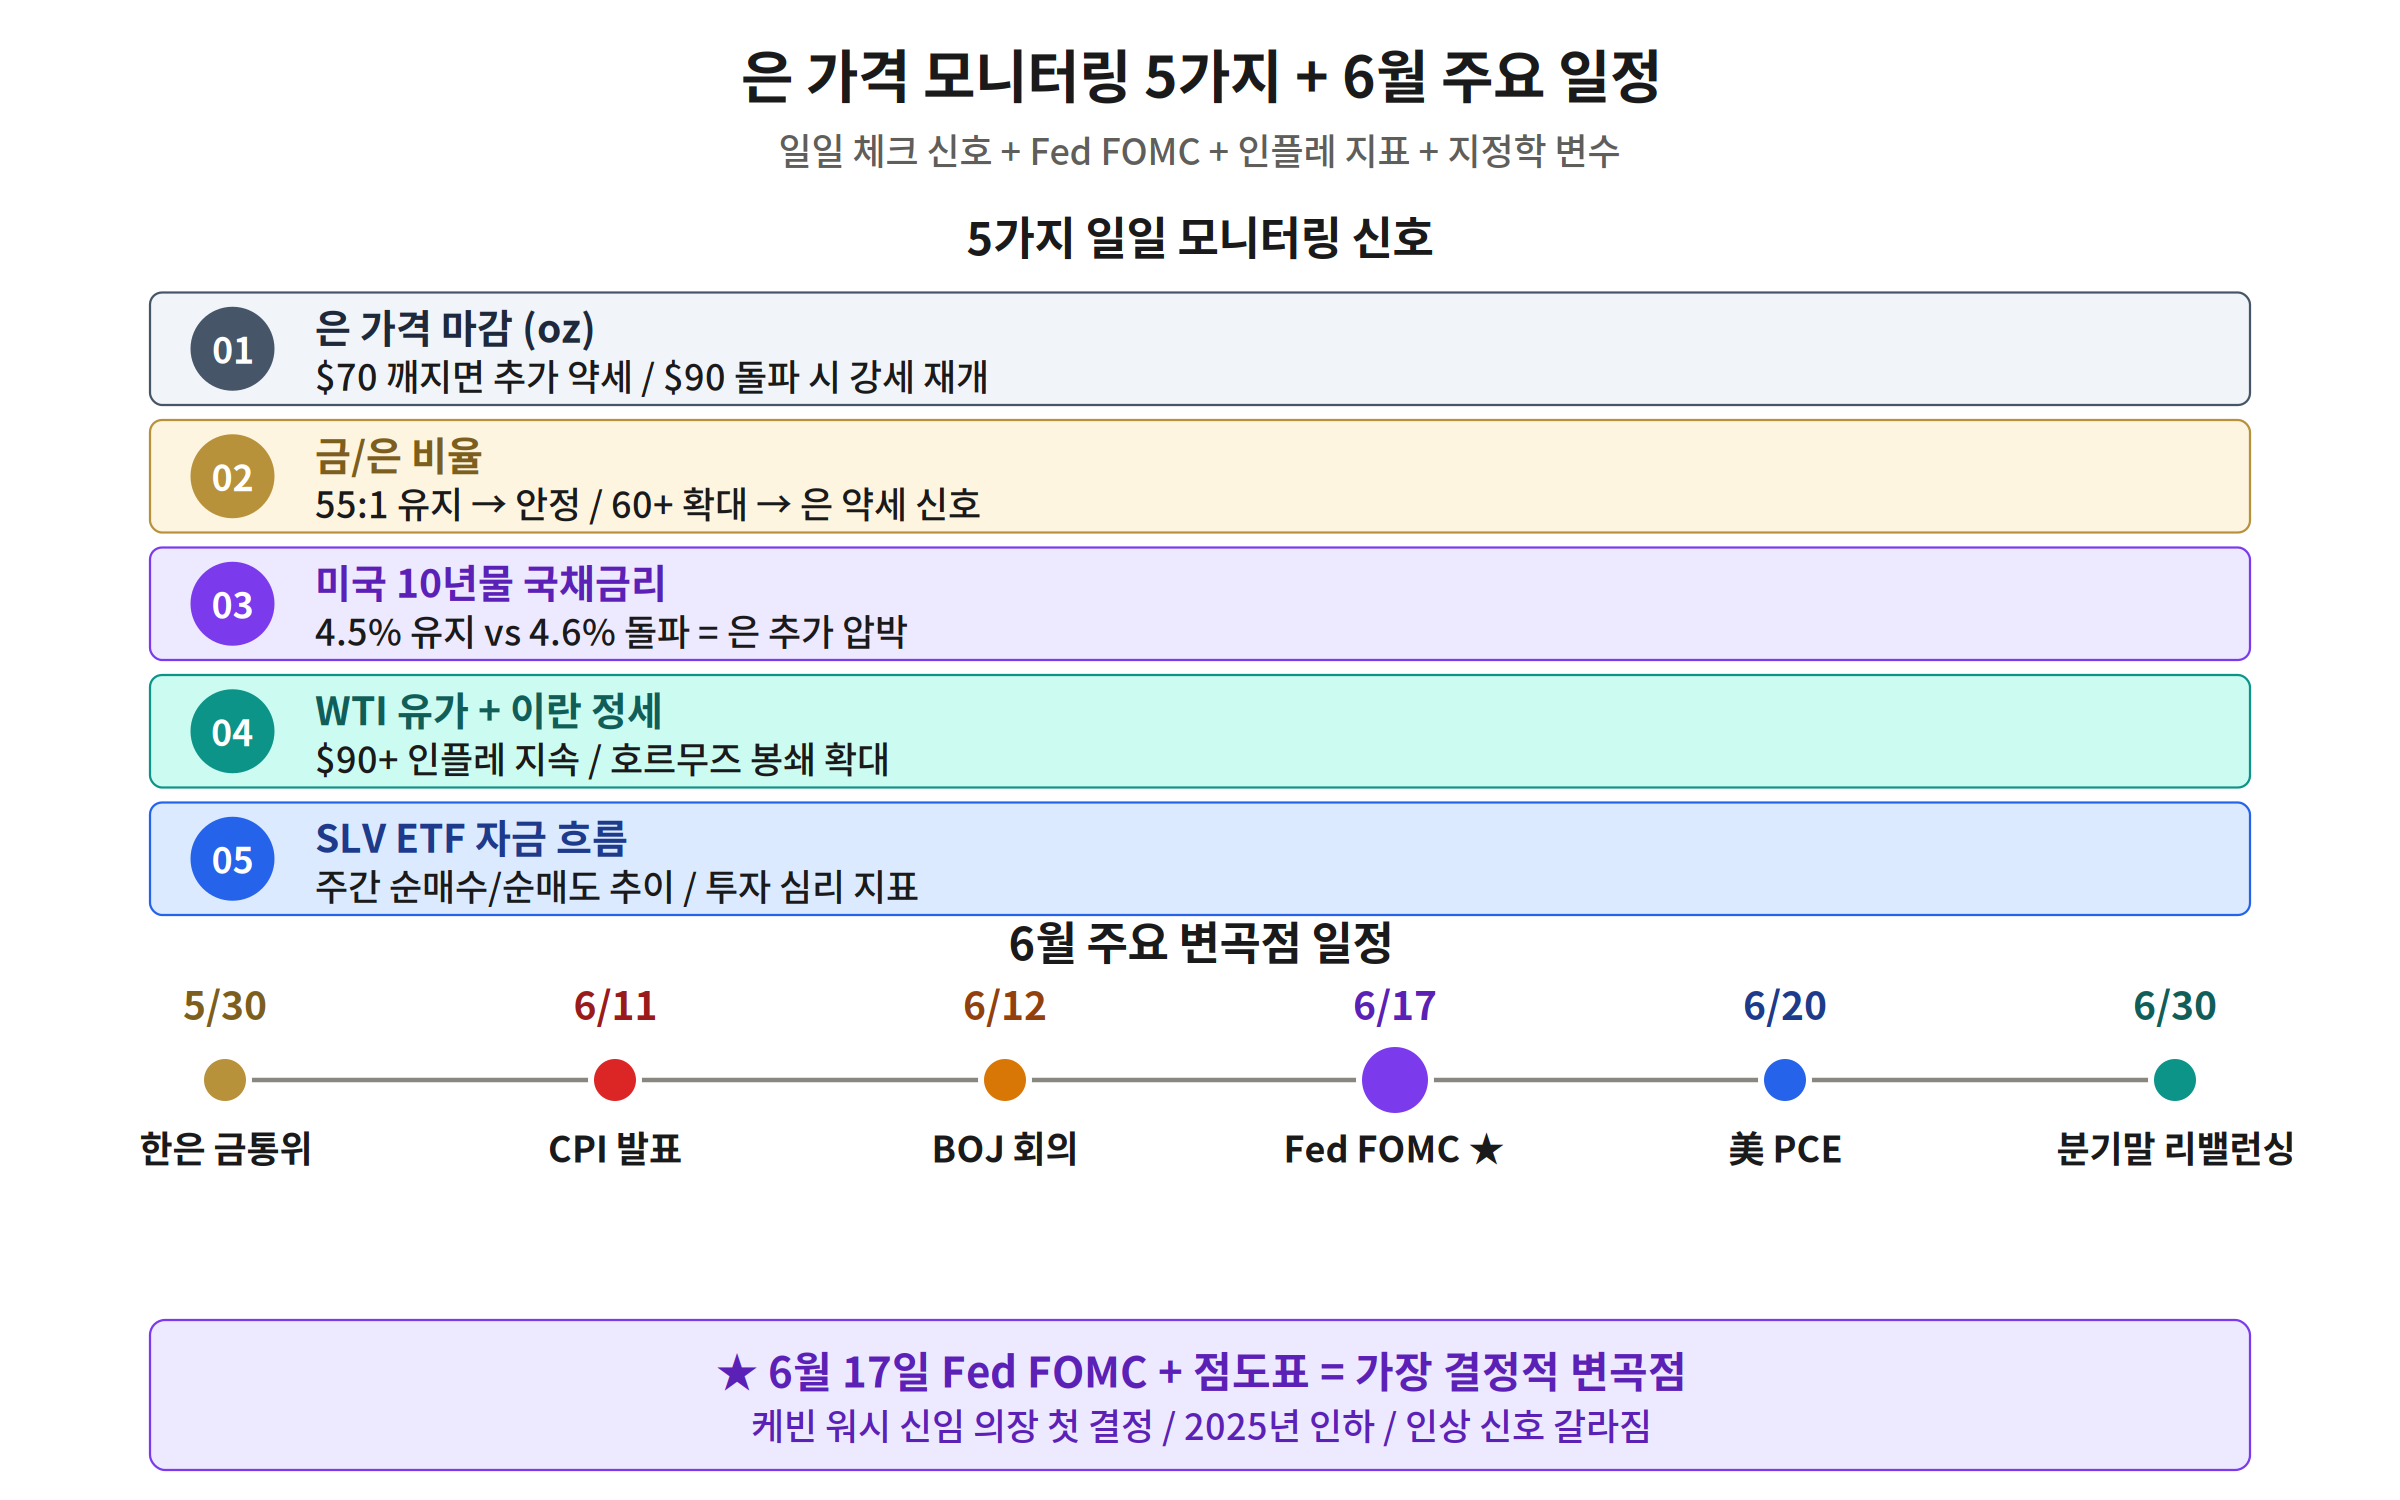
| Date | Event | Silver Price Impact |
|---|---|---|
| May 30 | BOK MPC | KRW direction → unhedged ETF sensitivity |
| Jun 5 | U.S. May Jobs Report | Dollar strength signal |
| Jun 17 ★ | Fed FOMC (Warsh) | Most decisive inflection point |
| Jun 20 | U.S. PCE Inflation | Rate cut timeline confirmation |
| Jun 30 | Silver Institute Q2 Demand | Solar/EV/AI demand actuals |
“Silver’s structural deficit — now in its fifth consecutive year — means every price dip is a potential accumulation opportunity. The question is not if, but when.”
— BlackRock Commodities Research (May 2026)
The silver price forecast 2026 consensus centers on $80–$92 — above current spot of $76 — supported by a persistent structural deficit, three industrial mega-trends, and a gold/silver ratio that has already repriced silver as a technology metal. The $76 correction is painful but the five-year demand picture is unchanged. Dollar-cost average across three tranches ($76 / $70 / $64), monitor the June 17 FOMC, and hold for the $90+ target range.