
US Oil Dominance Explained: Shale Revolution Record 13.6M b/d and 3 Oil Price Scenarios for 2026–2027
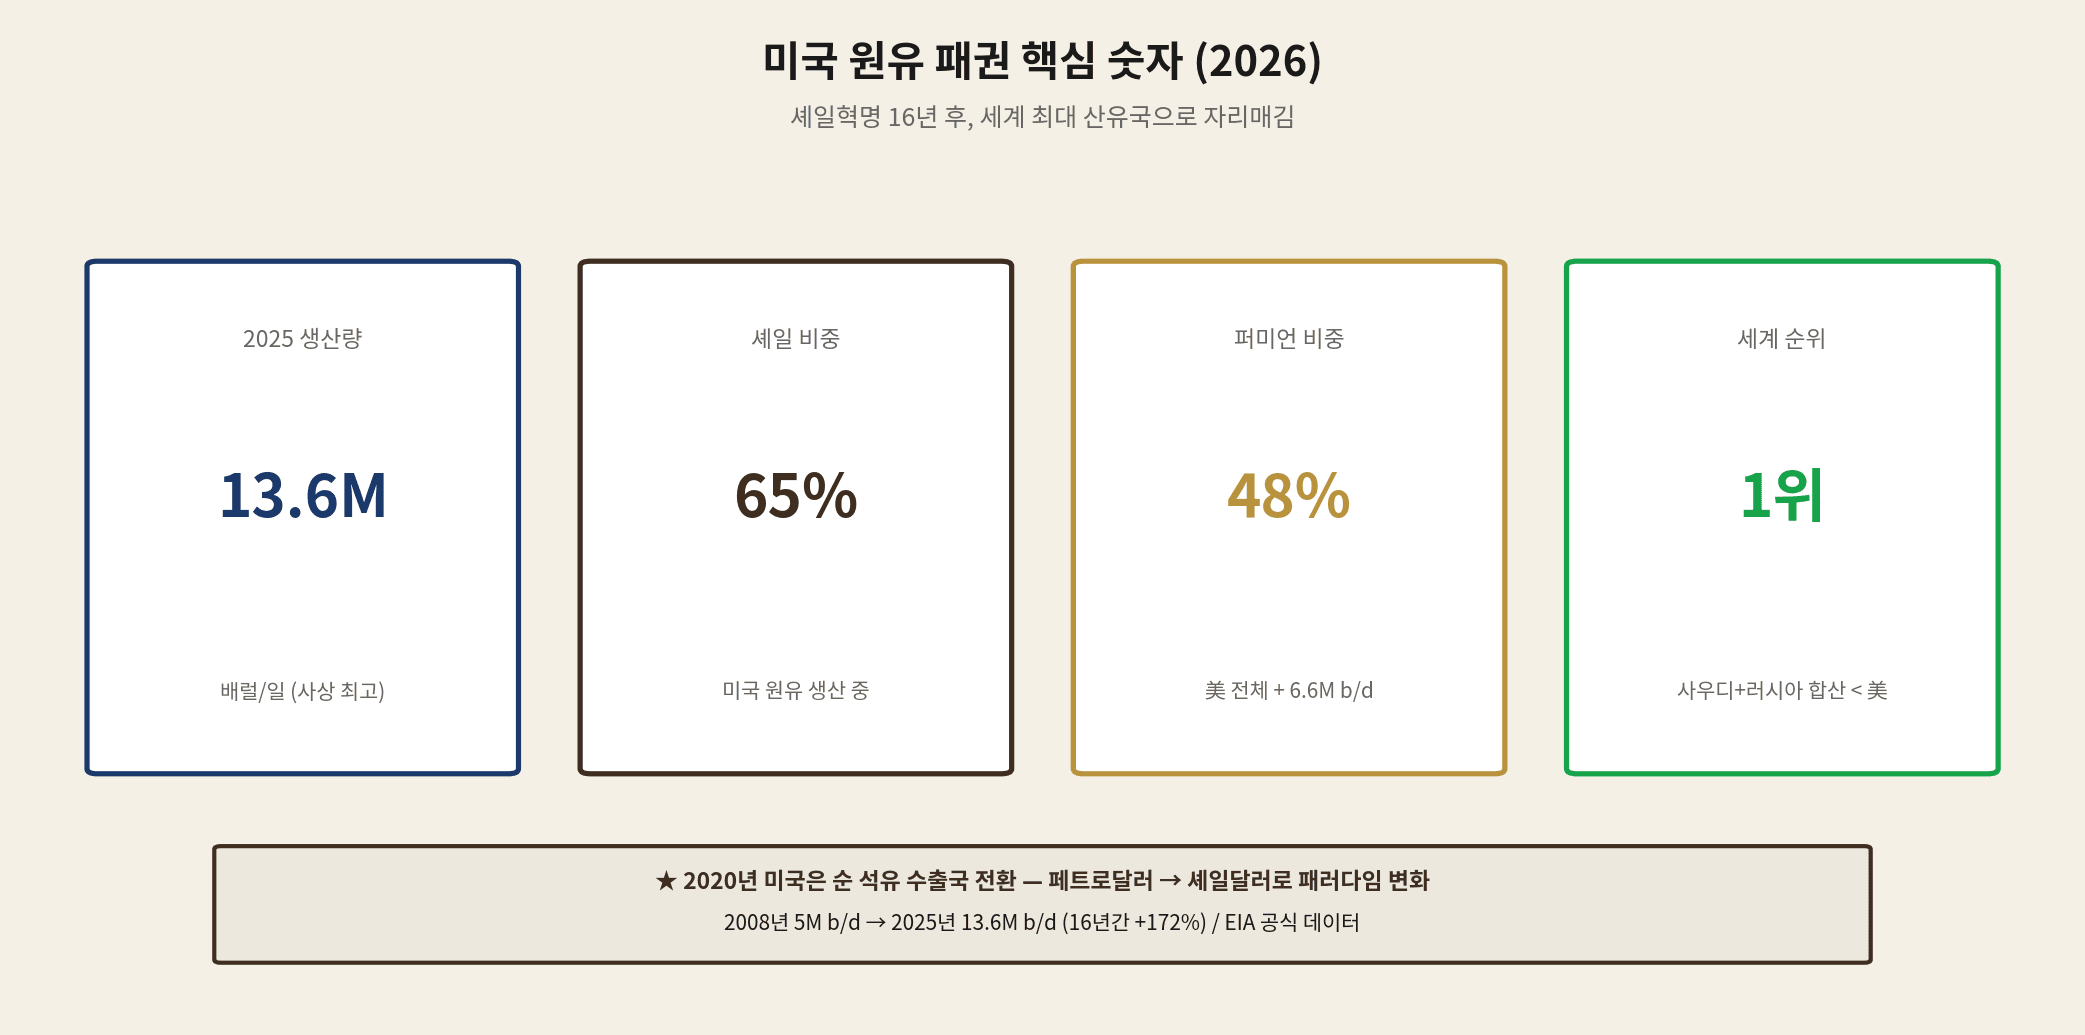
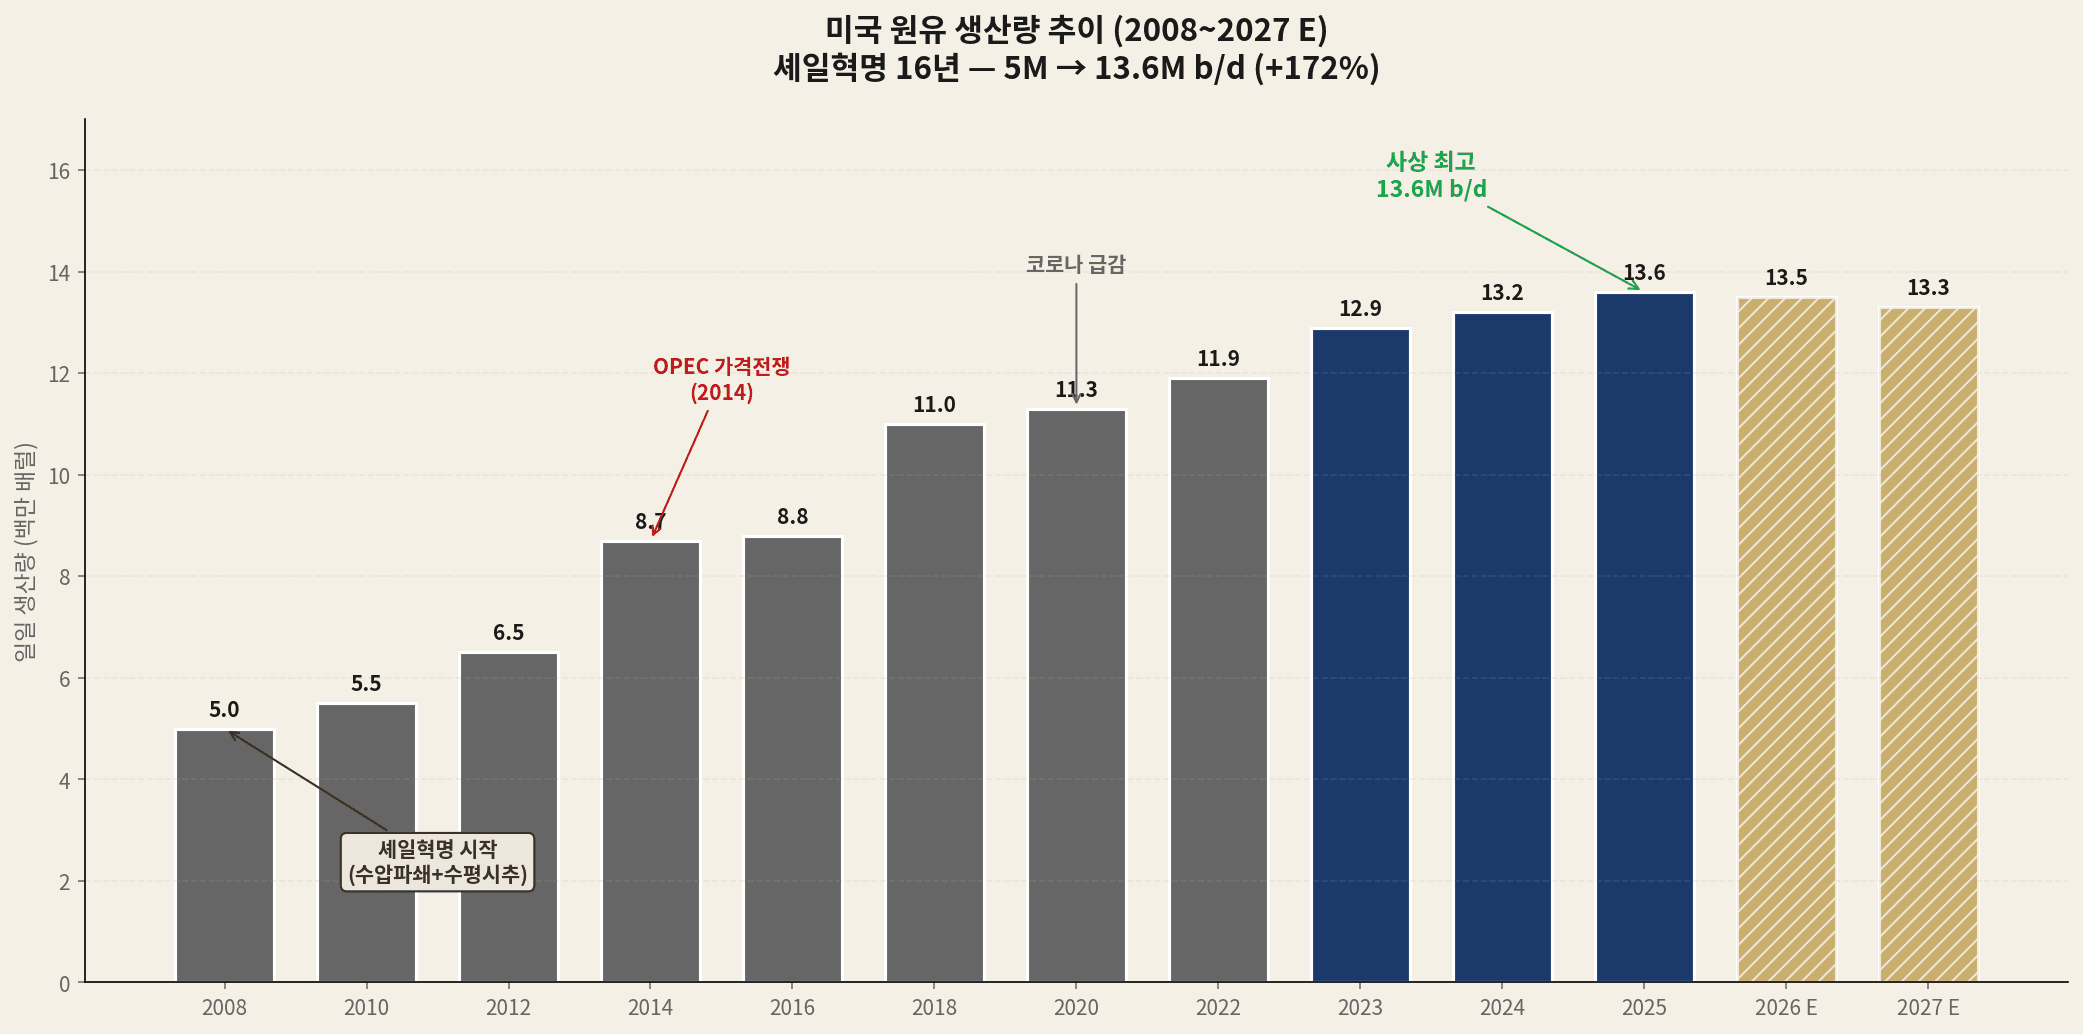
US crude oil production reached 13.6 million barrels per day (13.6M b/d) in 2025, an all-time record. From just 5M b/d in 2008, that’s a +172% surge in 16 years. This isn’t merely a production milestone — it signals a structural shift in global energy dominance.
The US, once deeply dependent on Saudi Arabia, now produces more oil than Saudi Arabia and Russia combined. Since 2020, it has been a net petroleum exporter. The petrodollar system that anchored global order for 50 years is giving way to a shale-dollar era.
This analysis covers: 16 years of the shale revolution, the US–Saudi–Russia production showdown, how the Iran War is reshaping markets, the Permian Basin’s outsized role, and — most importantly — three oil price scenarios for 2026–2027 and five signals Korean investors should track.
01 The Shale Revolution — From 5M to 13.6M b/d in 16 Years
US crude production was approximately 5M b/d in 2008 — after declining steadily for 30+ years from its 1970s peak. A single technology combination reversed that trend: hydraulic fracturing + horizontal drilling. Together, they unlocked vast shale formations previously considered unextractable.
| Year | Output (M b/d) | Key Event |
|---|---|---|
| 2008 | 5.0 | Shale revolution begins (Bakken, Eagle Ford) |
| 2014 | 8.7 | OPEC price war → WTI crashes to $26 |
| 2018 | 11.0 | US becomes world’s largest oil producer |
| 2020 | 11.3 | COVID demand shock + first net exporter year |
| 2023 | 12.9 | Annual average record |
| 2024 | 13.2 | +270K b/d (+2%) |
| 2025 | 13.6 | All-time record ★ |
| 2026 E | 13.5 | Plateau |
| 2027 E | 13.3 | First decline since 2021 |
02 US vs Saudi vs Russia — The Dominance Reversal
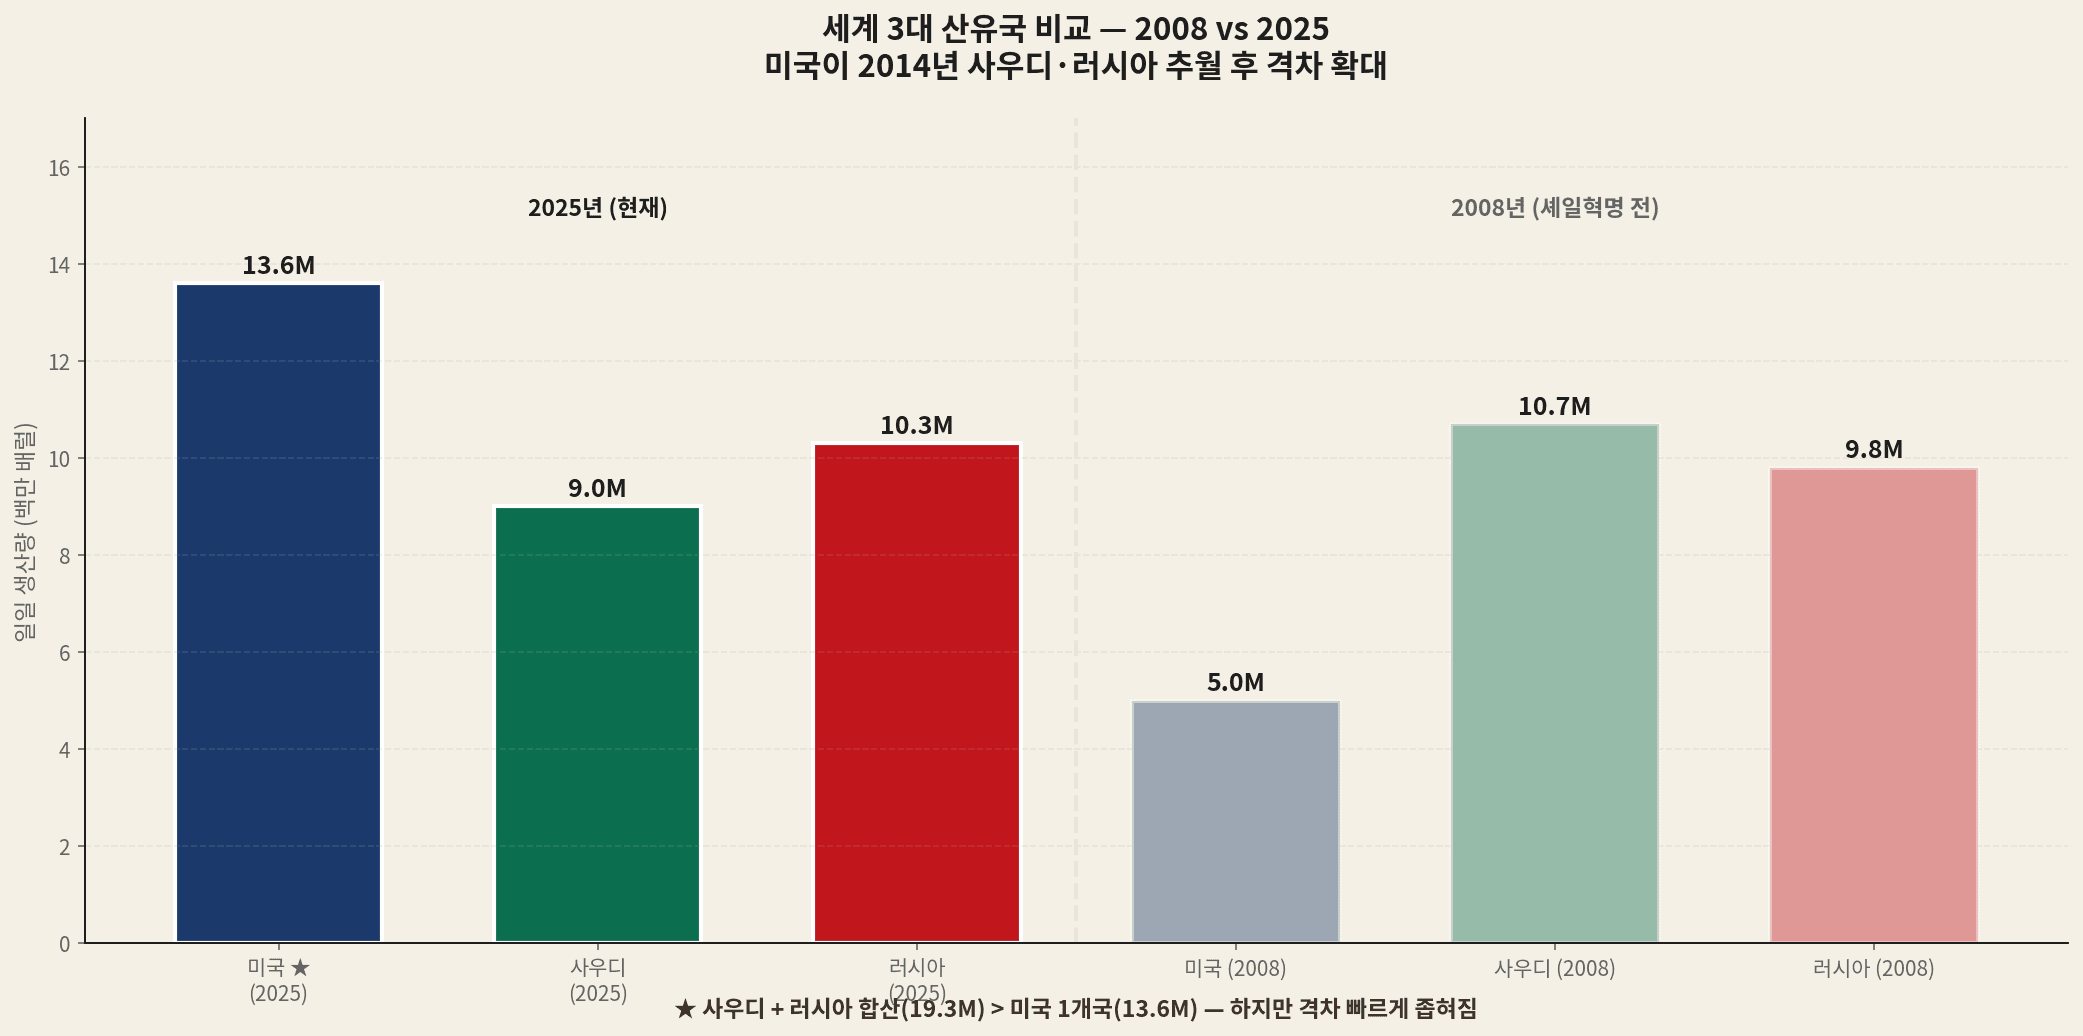
Compare the 2008 and 2025 oil maps and the power reversal is unmistakable. Saudi Arabia and Russia ranked 1st and 2nd in 2008. By 2025, the US leads by a wide margin.
| Country | 2008 (M b/d) | 2025 (M b/d) | Change |
|---|---|---|---|
| USA ★ | 5.0 | 13.6 | +172% |
| Saudi Arabia | 10.7 | 9.0 | -16% |
| Russia | 9.8 | 10.3 | +5% |
03 The Shale Revolution in 4 Stages
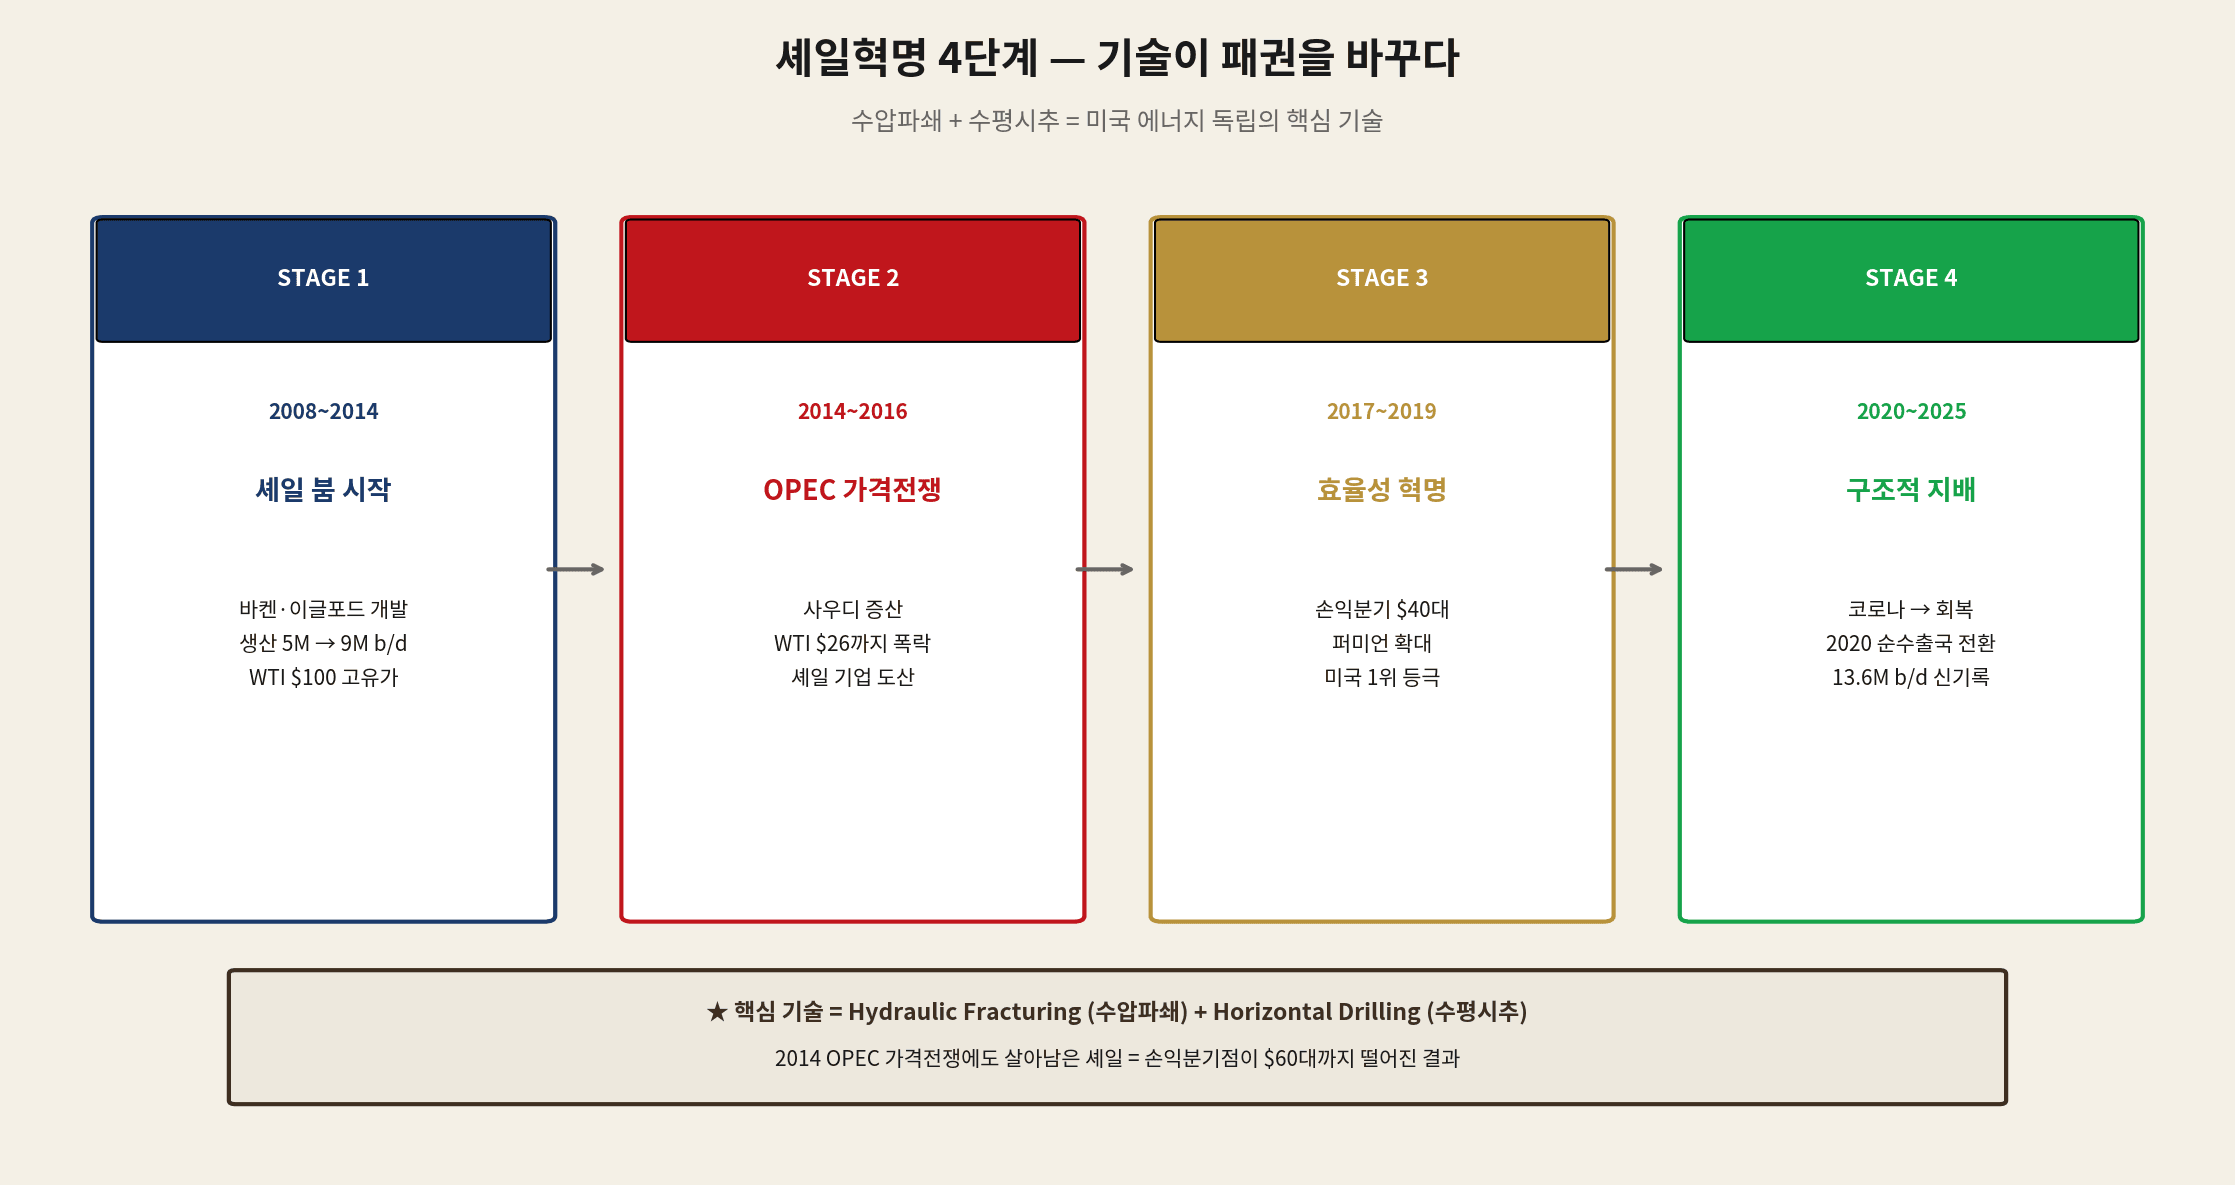
STAGE 1 (2008–2014): The Shale Boom Begins
Shale drilling spread rapidly from the Bakken (North Dakota) and Eagle Ford (Texas) fields starting in 2008. Hydraulic fracturing combined with horizontal drilling cracked open rock formations previously considered inaccessible. WTI above $100/barrel provided the financial fuel for rapid expansion.
STAGE 2 (2014–2016): OPEC’s Price War
In November 2014, Saudi-led OPEC launched a strategy to flood the market and crush US shale economics. WTI fell from $100 to $26. Dozens of US shale companies went bankrupt. But the industry did not collapse.
STAGE 3 (2017–2019): The Efficiency Revolution
Survivors slashed breakeven costs from the $80s to the $40s per barrel. AI-driven optimization, electric fracking, and automated drilling drove productivity higher. By 2018, the US had become the world’s largest oil producer.
STAGE 4 (2020–2025): Structural Dominance
After a COVID-driven demand shock in 2020, production rebounded fast. 2020 marked the first year the US was a net petroleum exporter. Every year since set a new record, culminating in 2025’s 13.6M b/d all-time high.
04 Petrodollar → Shale Dollar — A Paradigm Shift
The petrodollar system — launched by Kissinger and Saudi Arabia in 1974 — mandated that OPEC oil be priced in US dollars. This locked in America’s global reserve currency status for 50 years. In exchange, the US deployed massive military force to protect the Saudi monarchy.
The shale revolution disrupts this arrangement. As the US achieves energy self-sufficiency, its dependence on Saudi Arabia has dropped sharply — and so has its incentive to maintain the petrodollar at all costs.
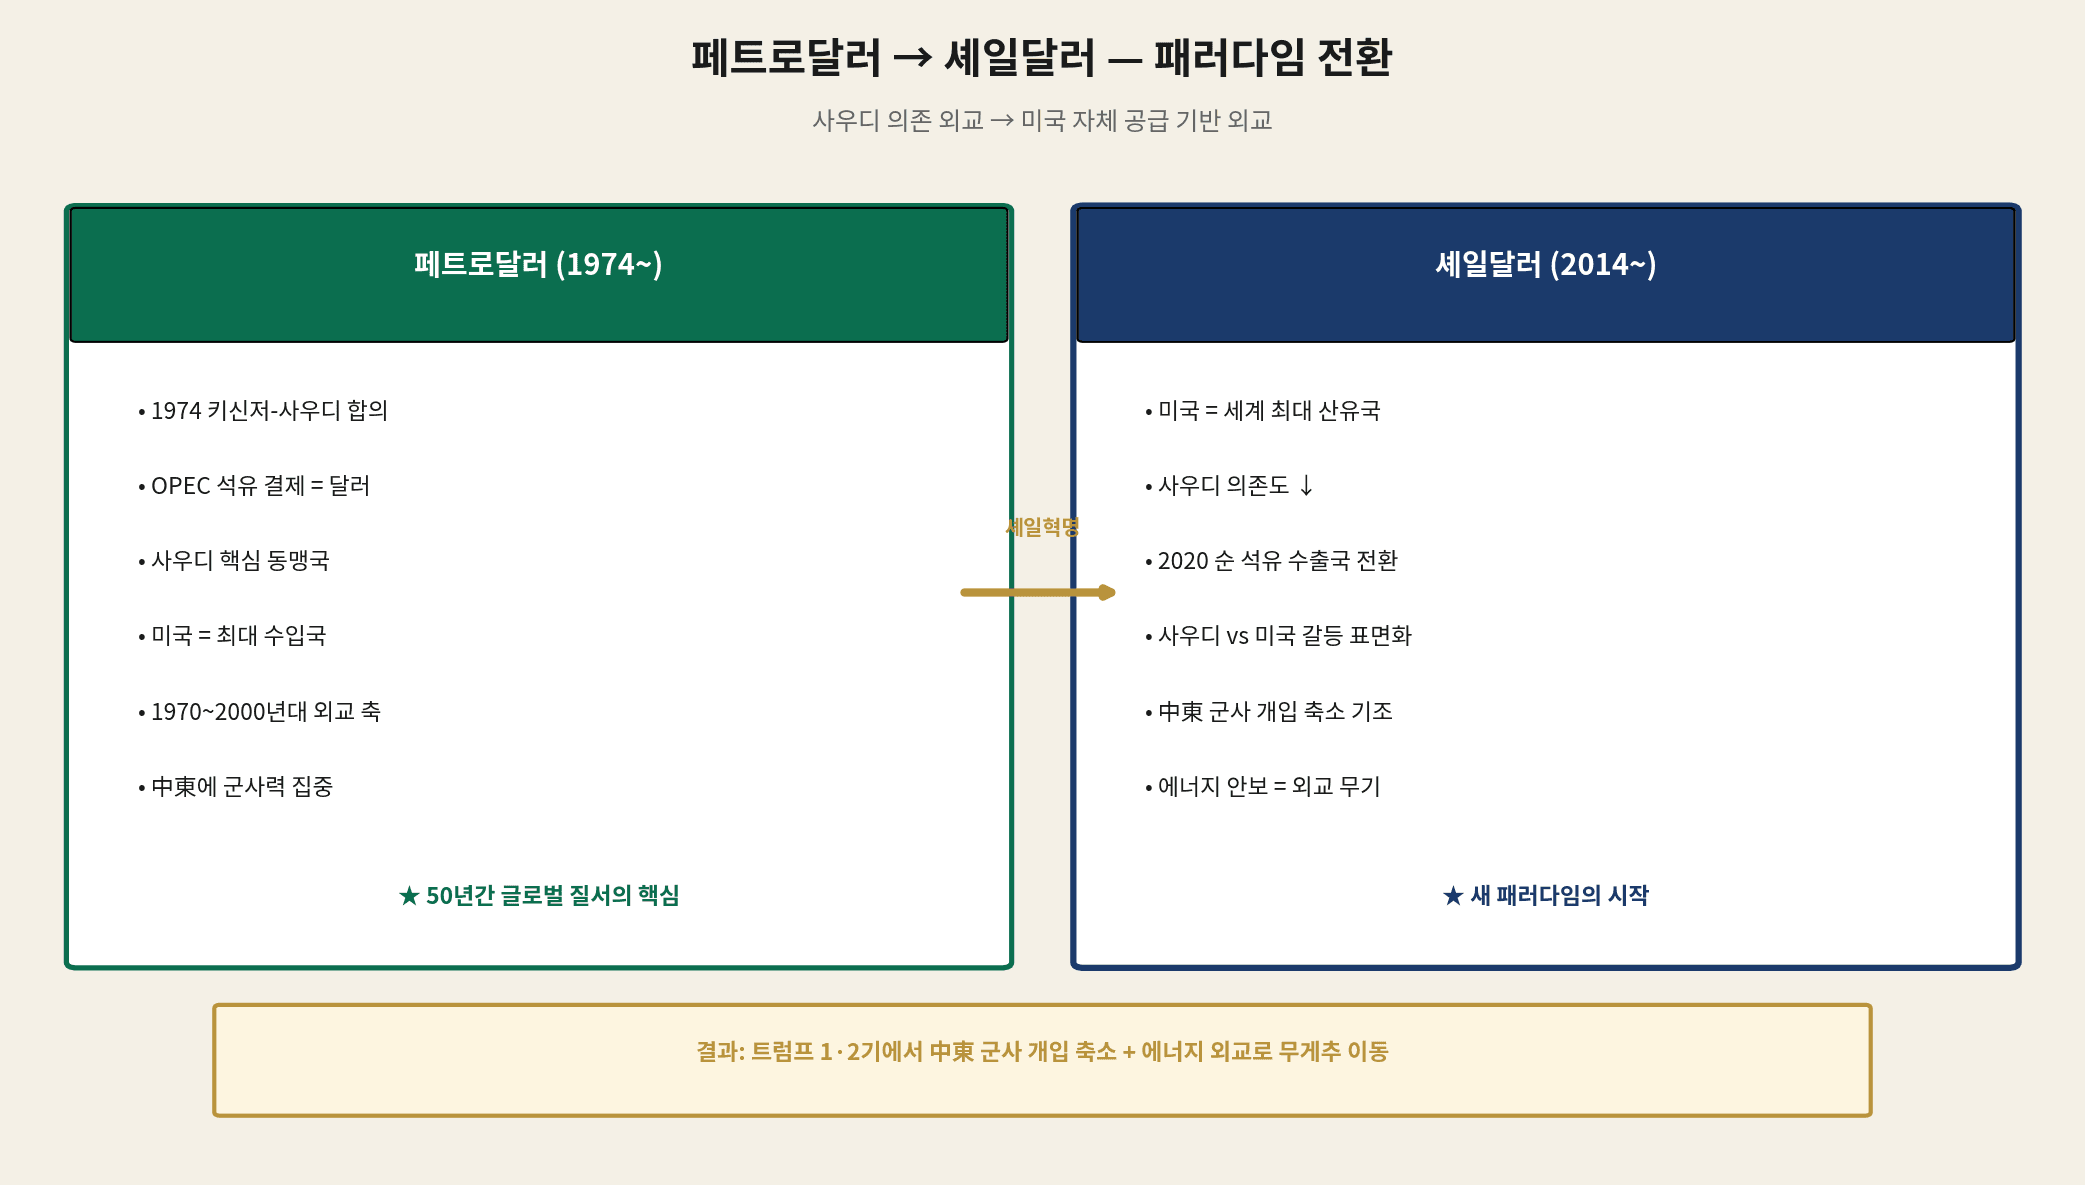
| Dimension | Petrodollar (1974–) | Shale Dollar (2014–) |
|---|---|---|
| Core Ally | Saudi Arabia (Washington-Riyadh axis) | US self-supply + diversified alliances |
| Middle East Military | Massive presence + intervention | Drawdown + burden-sharing |
| OPEC Influence | Absolute (price setter) | Relative (US provides balance) |
| Foreign Policy Tool | Dollar-only settlement mandate | Energy exports + sanctions leverage |
| Defining Event | 1973 Oil Crisis | 2022 Russia sanctions / 2026 Iran War |
05 Iran War + Hormuz Blockade — Testing US Dominance
On February 28, 2026, US and Israeli strikes on Iran triggered a war that has shaken global oil markets. The Strait of Hormuz is effectively blockaded, causing the largest supply disruption in recorded history.
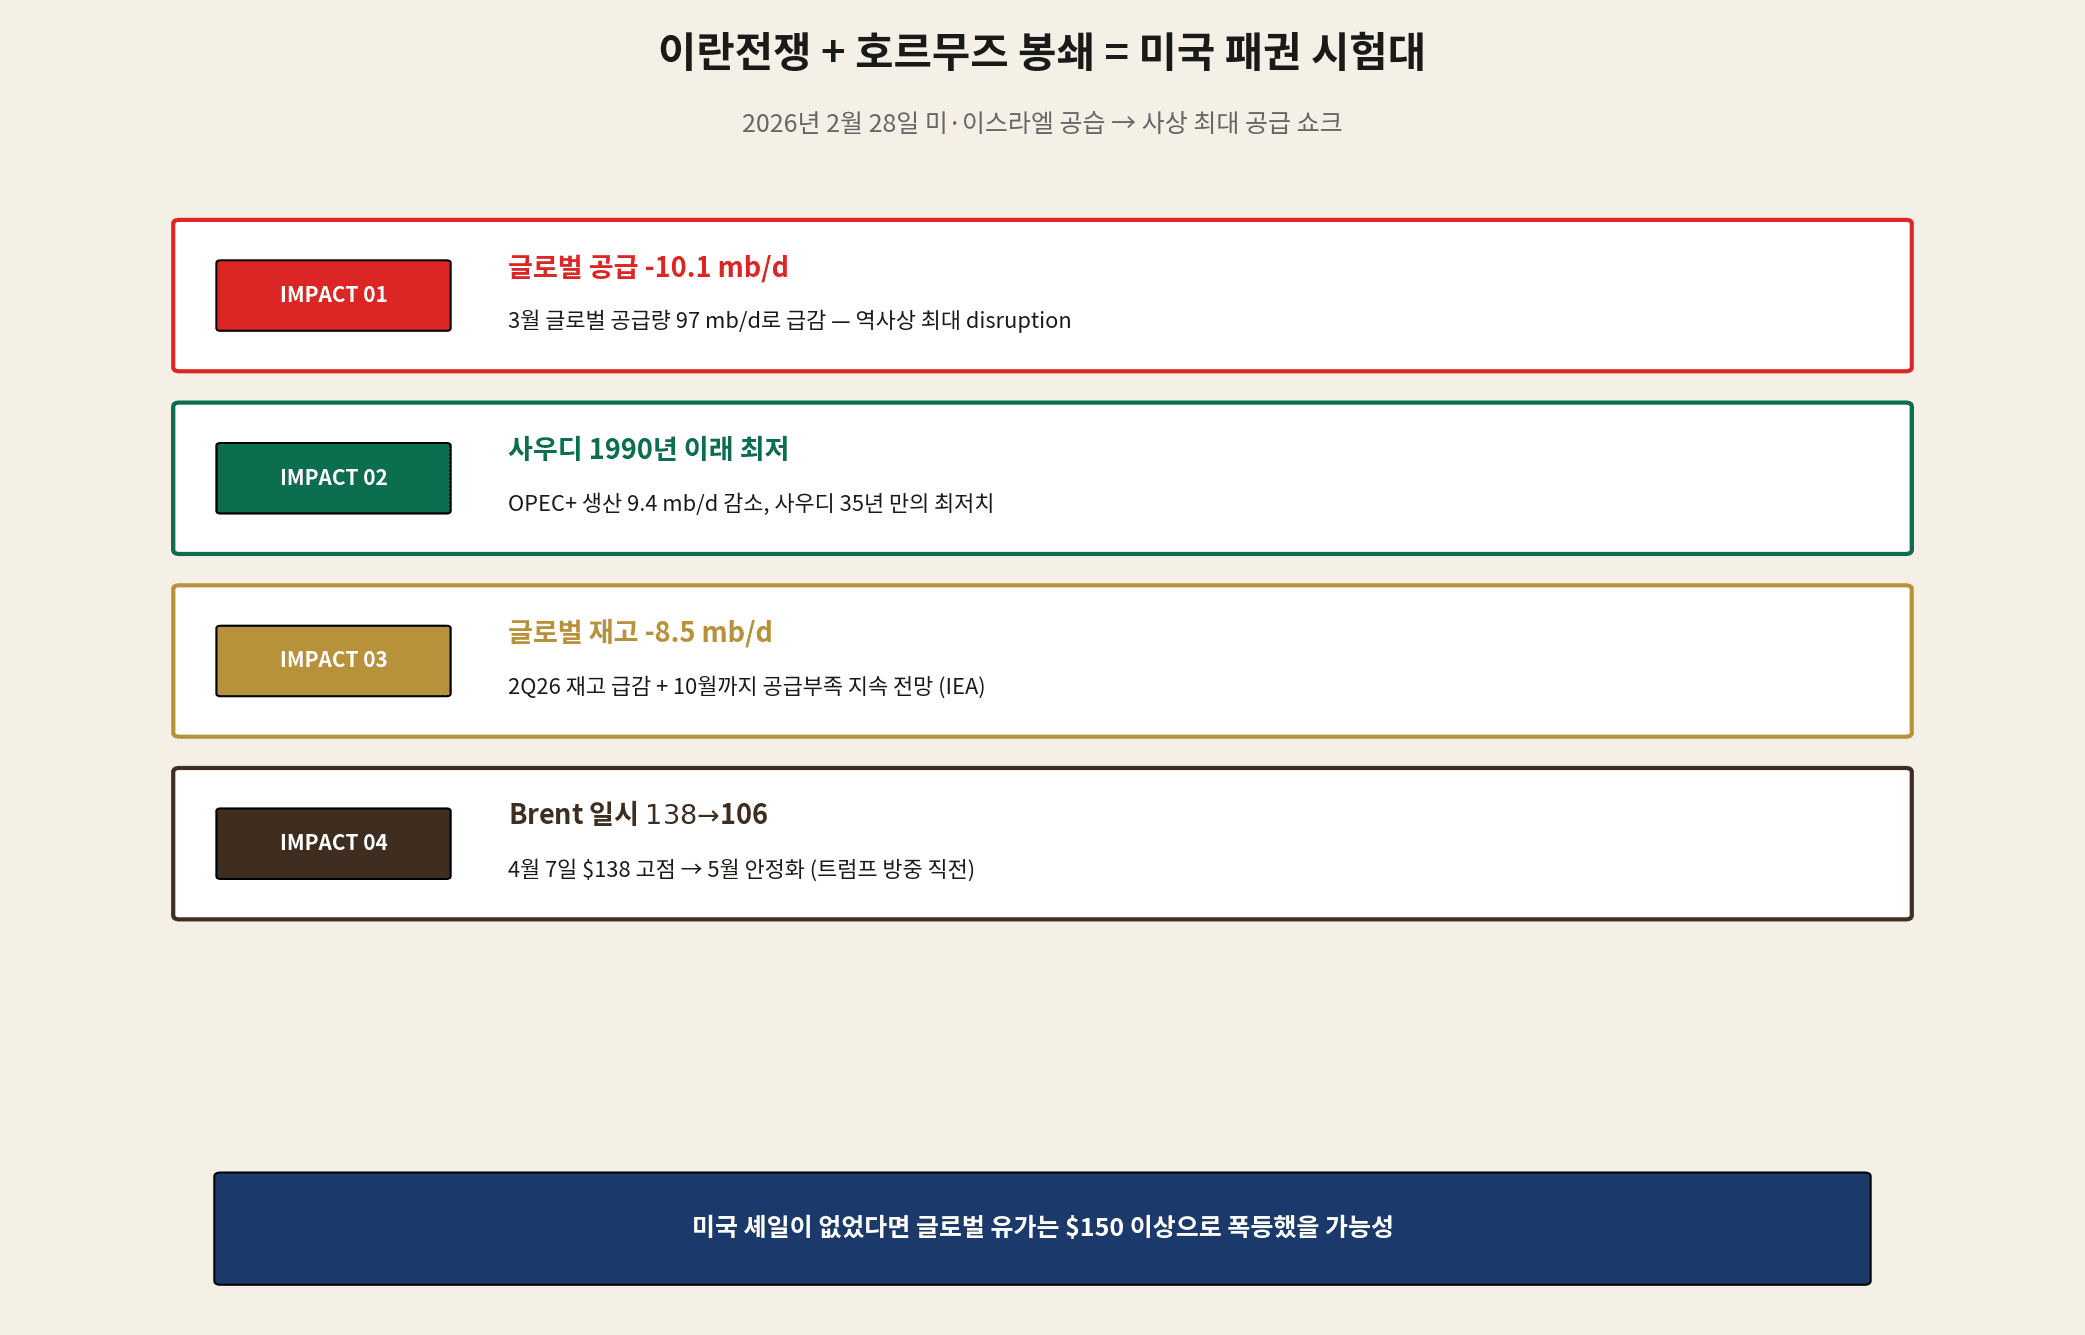
| Indicator | Current Status | Significance |
|---|---|---|
| Global Supply (March) | -10.1 mb/d | Largest disruption on record |
| OPEC+ Production Drop | -9.4 mb/d | Infrastructure attacks + Hormuz blockade |
| Saudi Production | Lowest since 1990 | 35-year nadir |
| Global Inventory (2Q26) | -8.5 mb/d | Supply deficit extends to October |
| Brent Price | April $138 → May $106 | Spike then partial stabilization |
| WTI (May 14) | $101+ | On eve of Trump China visit ★ |
06 The Permian Basin — Heart of US Shale Dominance
Nearly half of all US shale production originates from a single region: the Permian Basin — a vast shale formation spanning West Texas and southeastern New Mexico.
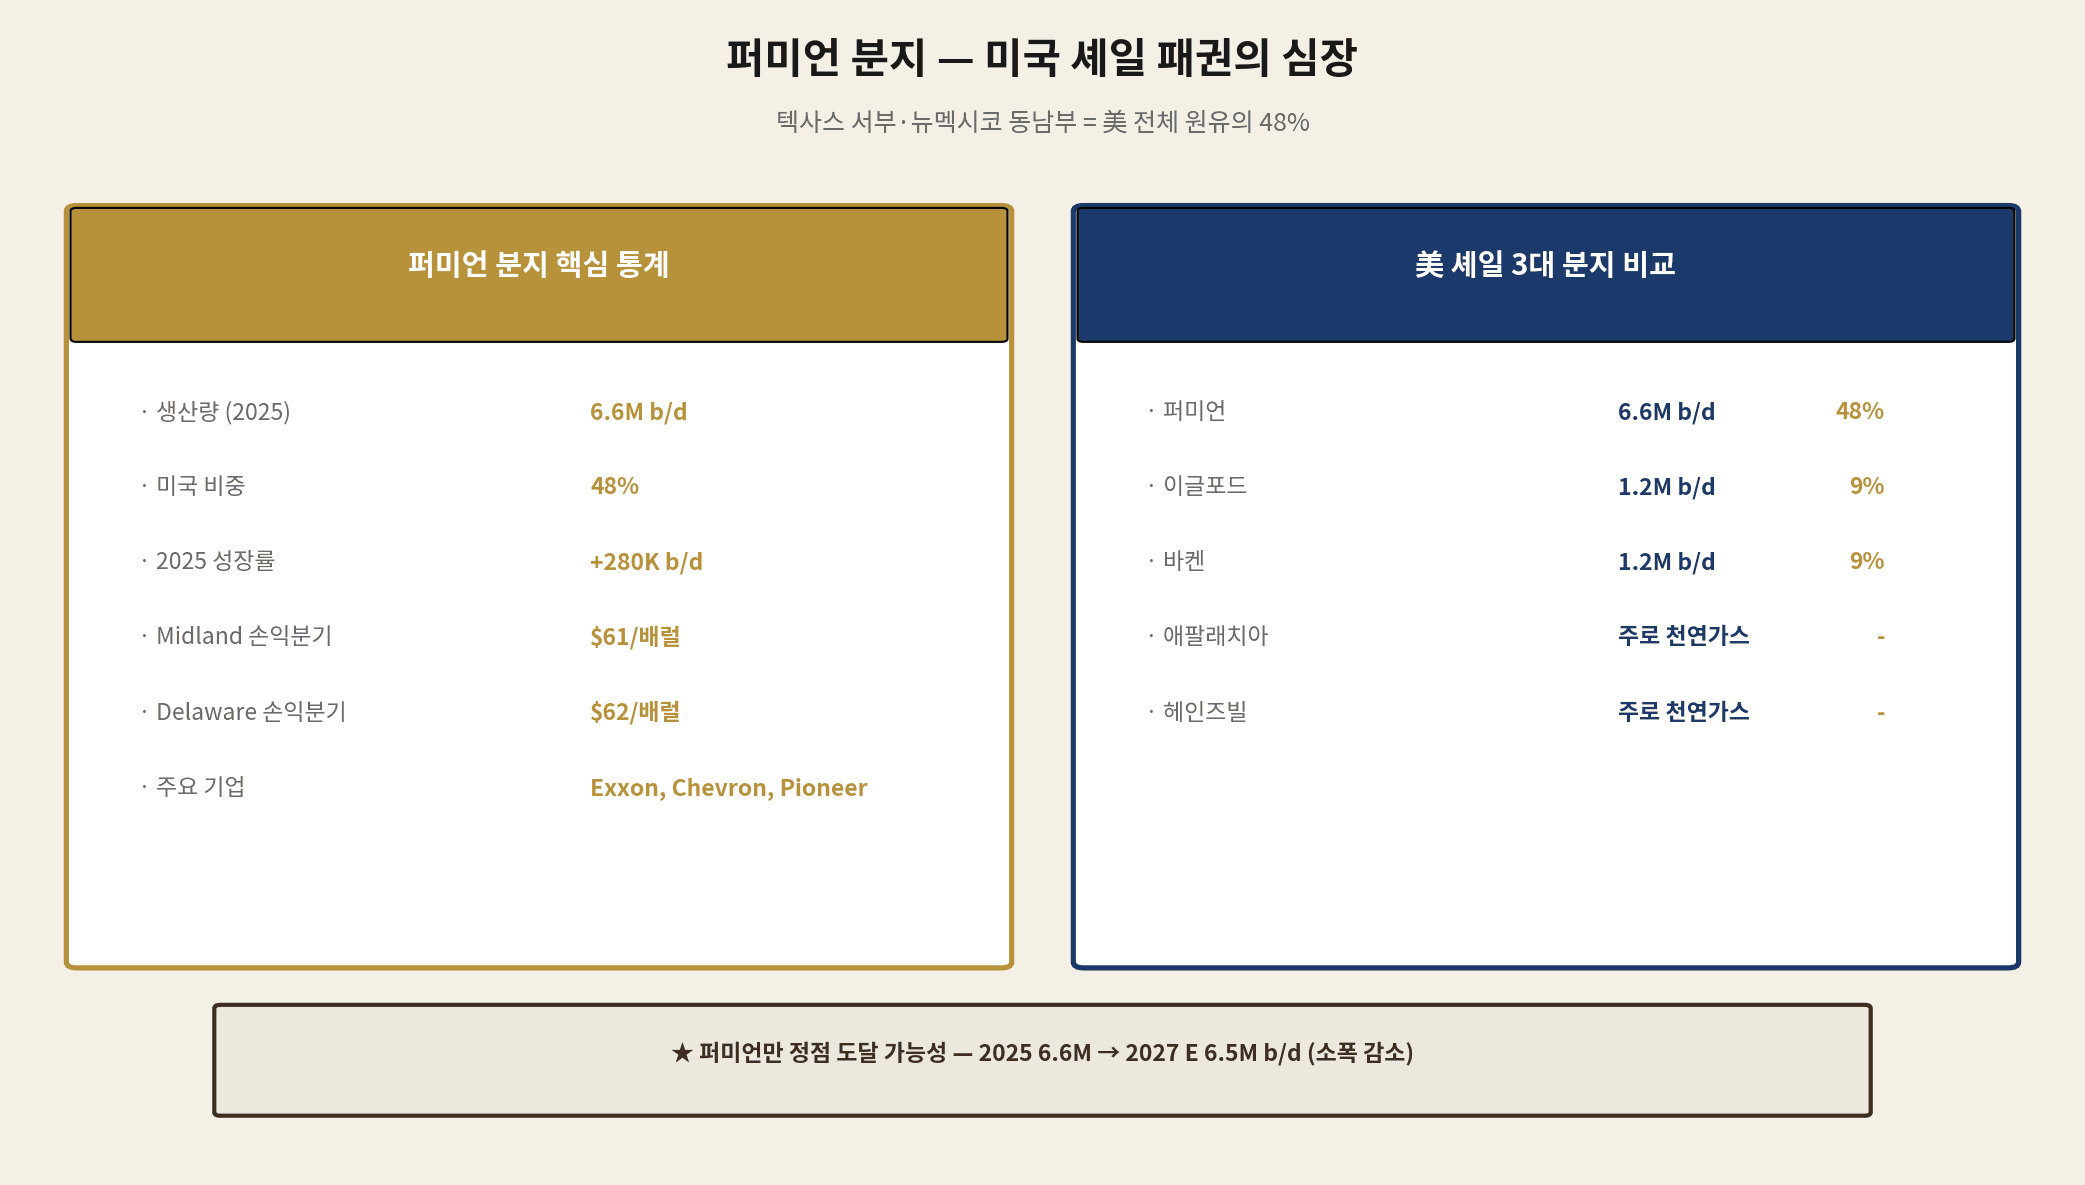
| Metric | Value |
|---|---|
| 2025 Production | 6.6M b/d (48% of total US output) |
| 2025 Growth | +280K b/d (80% of US growth) |
| Midland Basin Breakeven | $61/barrel |
| Delaware Basin Breakeven | $62/barrel |
| Key Operators | ExxonMobil, Chevron, Pioneer Natural Resources, ConocoPhillips |
| 2027 Forecast | 6.5M b/d (slight decline) |
07 Oil Price Outlook 2026–2027: Three Scenarios
The critical question: where does oil go from here? We model three scenarios based on three variables: Iran War trajectory, OPEC+ decisions, and US shale resilience.
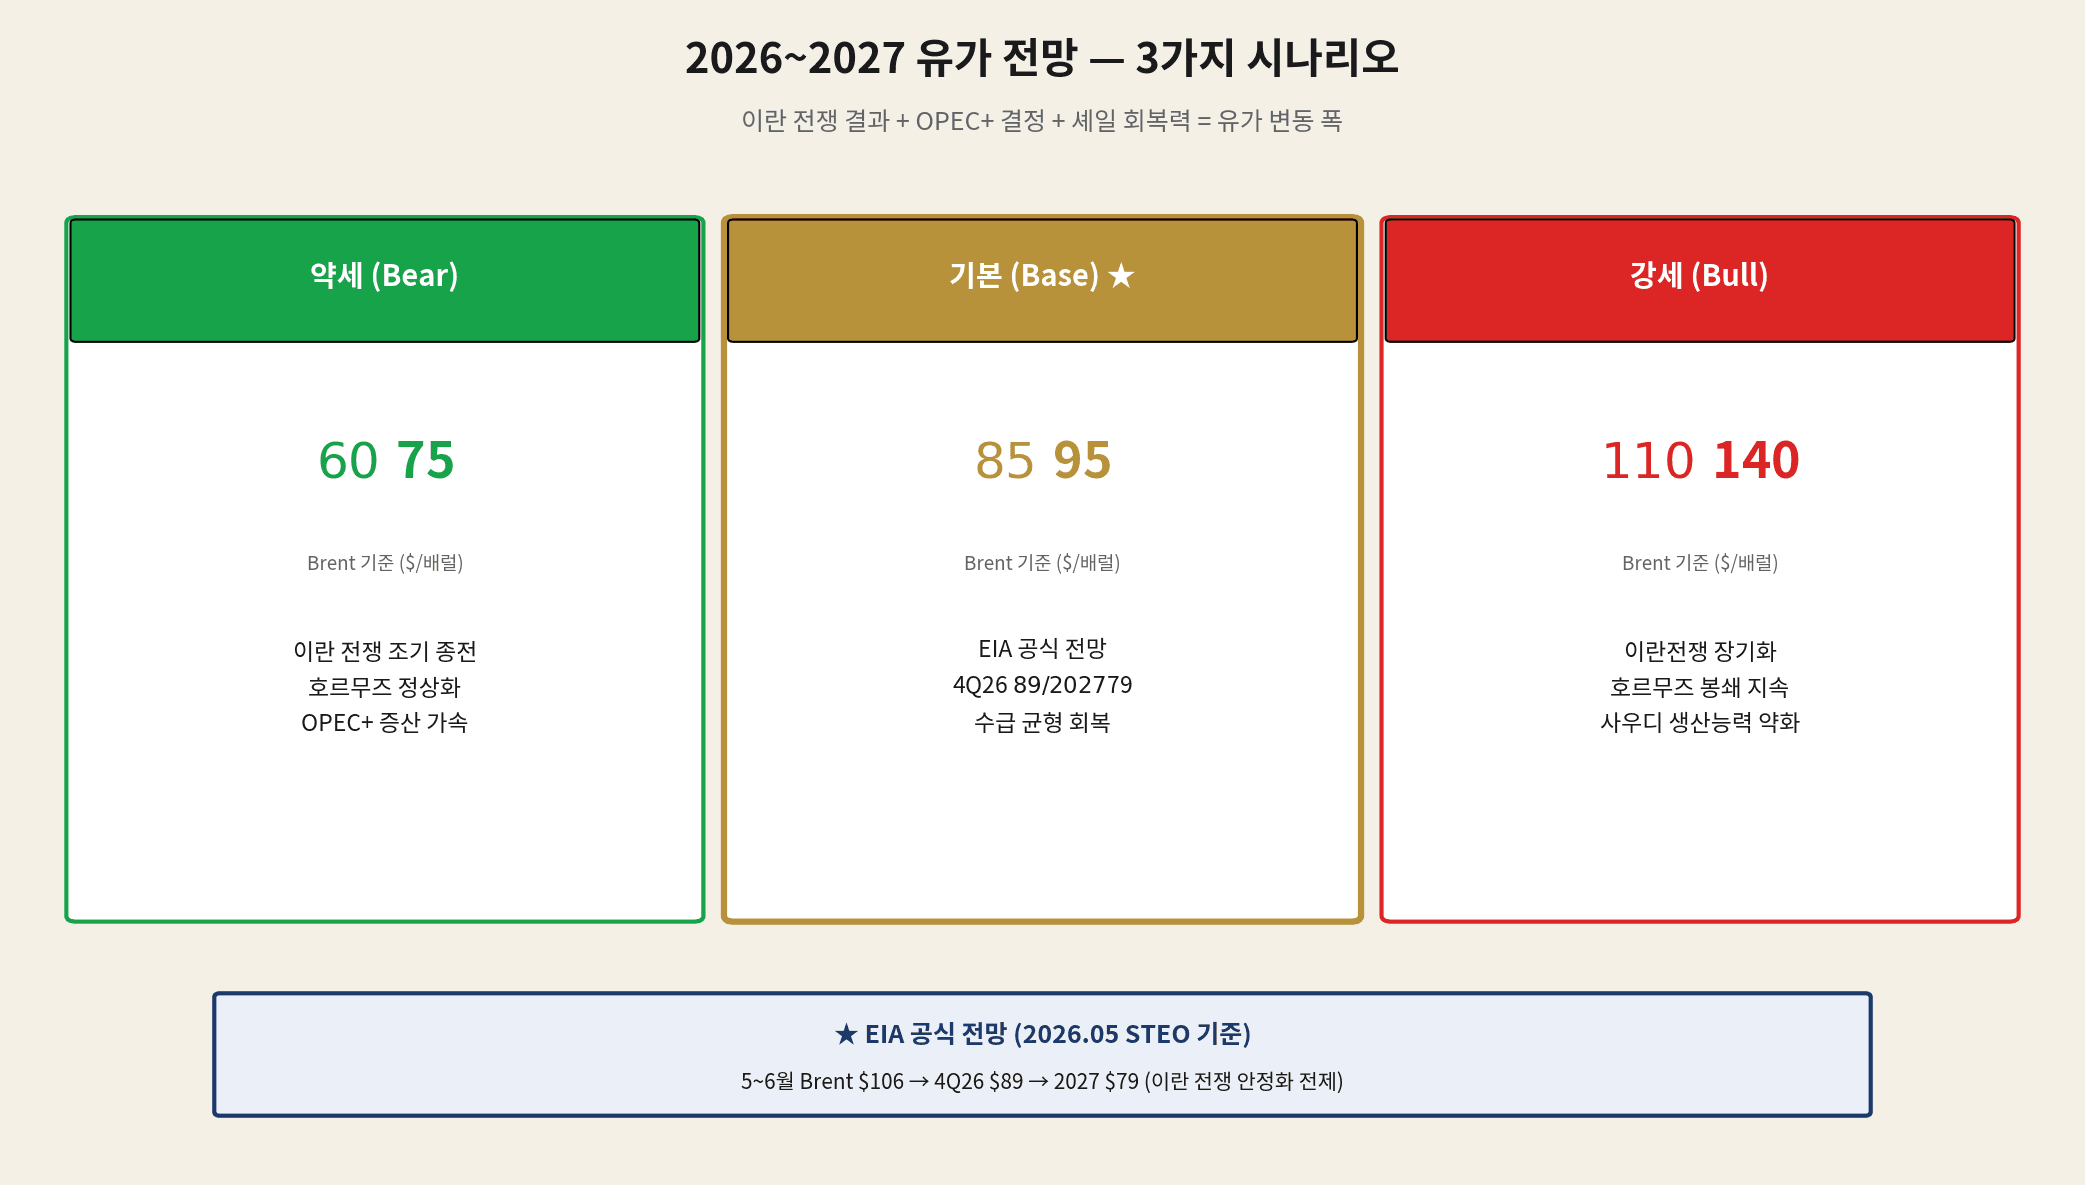
| Scenario | Brent Range | Key Assumptions |
|---|---|---|
| Bear | $60–$75 | Iran conflict ends quickly + Hormuz reopens + OPEC+ accelerates production |
| Base ★ | $85–$95 | EIA official: 4Q26 $89 / 2027 avg $79 |
| Bull | $110–$140 | Iran War drags on + Hormuz remains closed + Saudi recovery delayed |
EIA May STEO Official Forecast (Base Scenario)
- May–June 2026: Brent $106 (current levels hold)
- 4Q 2026: Brent $89 (assuming Iran stabilization)
- 2027 Average: Brent $79 (supply normalization + OPEC recovery)
- WTI Average: ~$5–10 discount to Brent
08 Five Signals Korean Investors Must Watch
US energy dynamics hit Korea’s economy directly. Korea is the world’s 5th-largest oil importer; 70% of its crude comes from the Middle East. Oil prices ripple through gasoline, aviation, refining, and even semiconductors.
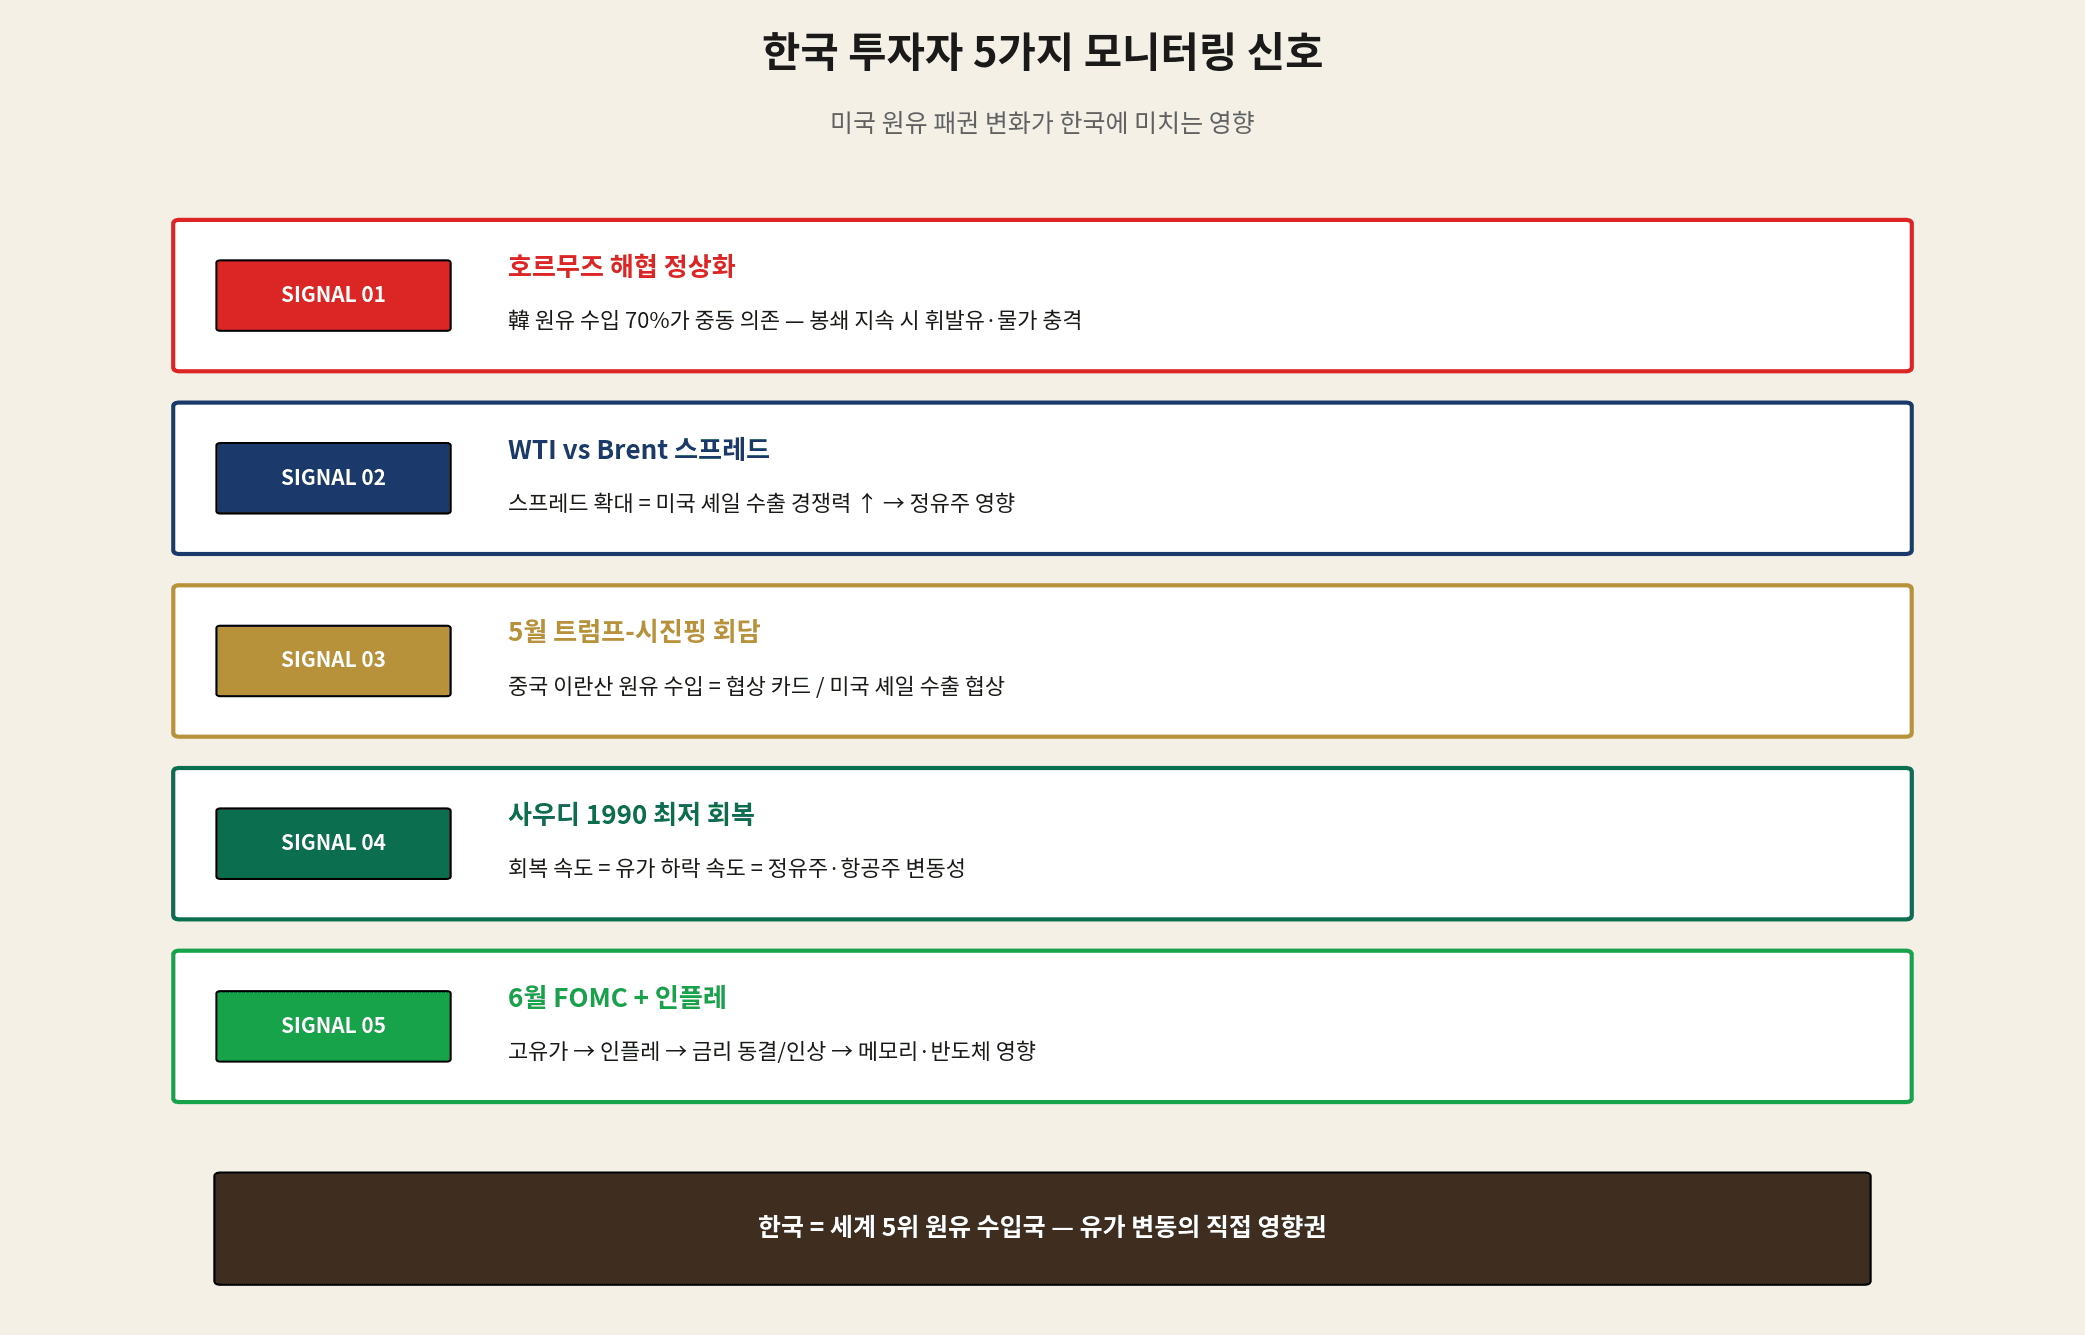
- SIGNAL 1: Hormuz Normalization — Korea imports 70% of crude via Middle East routes. Prolonged blockade drives domestic fuel prices and inflation directly.
- SIGNAL 2: WTI–Brent Spread — Widening spread = rising US shale export competitiveness → impacts Korean refiners (SK Innovation, S-Oil)
- SIGNAL 3: Trump–Xi Summit Outcome — Chinese imports of Iranian crude are a key bargaining chip. US shale export terms will affect Korea’s trade flows as well.
- SIGNAL 4: Saudi Production Recovery Speed — Speed of recovery from 35-year lows determines how fast oil prices fall = volatility for Korean airlines (Korean Air, Asiana) and refiners.
- SIGNAL 5: June FOMC + Inflation — High oil → inflation → rate hold/hike → pressure on memory chips (Samsung, SK Hynix).
09 Conclusion — How to Frame US Oil Dominance
In the 16 years it took US production to climb from 5M to 13.6M b/d, global order shifted accordingly. The Saudi-dependent petrodollar evolved into a self-sufficient shale dollar. The US now deploys military force in the Middle East while simultaneously using shale exports as a global market counterweight.
As of May 2026, that dominance is being tested. The Iran War has pushed Saudi production to a 35-year low and caused the largest supply shock ever recorded. Yet oil hasn’t hit $200 — because US shale is absorbing the blow.
For Korean investors, the rational framework is: “Oil’s ceiling is $140, its floor is $60.” Within that band, track the five signals weekly and monitor sector-specific exposure across refiners, airlines, and semiconductors.
② Base scenario ($85–$95): EIA official view. 4Q26 stabilization → 2027 normalization
③ Bear scenario ($60–$75): Iran ceasefire + OPEC+ ramp. Shale expansion slows
④ Korea’s direct exposure: Refiners and airlines most oil-sensitive. Semiconductors via inflation → rates (indirect)
⑤ Long-term signal: US dominance continues, but watch the 2027 shale plateau — first decline since 2021 is the structural tell